Network Diagnostic Tool
Overview
The Network Diagnostic Tool app provides option to the administrator to access some frequently used networking tools like Ping and Tracepath. The app is built to provide a great deal of networking related information to the administrator. The features of this tool is widely used to find causes of glitches in the network interface. The Network Diagnosis Tool provides enhanced capabilities to Ping which helps to analyse the host and check whether it’s responding. The tracepath feature of the network diagnostic tool is used by Crystal Eye XDR administrators to trace the journey of a data that it undertakes to reach a designated destination.
Installation
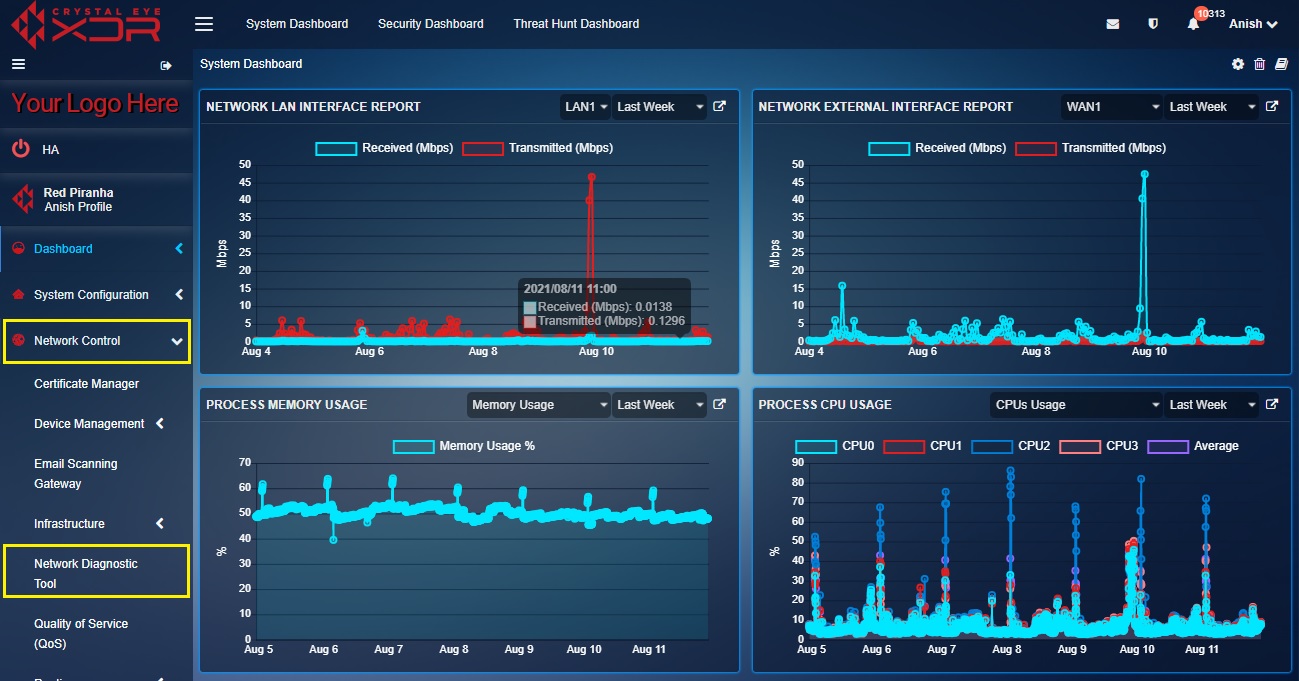
The Network Diagnostic Tool is a default application and can be accessed from the left-hand navigation panel.
Navigation to the Network Diagnostic Tool
Left-hand Navigation Panel > Network Control > Network Diagnostic Tool 
Ping
The Ping feature of the Network Diagnostic Tool app analyses a remote host and checks whether it’s responding and alive to ICMP packets. The feature is basic, and also includes the functionality that allows the administrator to determine and control the number of set packets set while pinging.
Note
Ping in itself is a Linux command. However, an administrator can run a ping command with the help of Ping functionality directly from the graphic user interface of the Crystal Eye XDR.
How to Use Ping Feature of Network Diagnostic Tool?
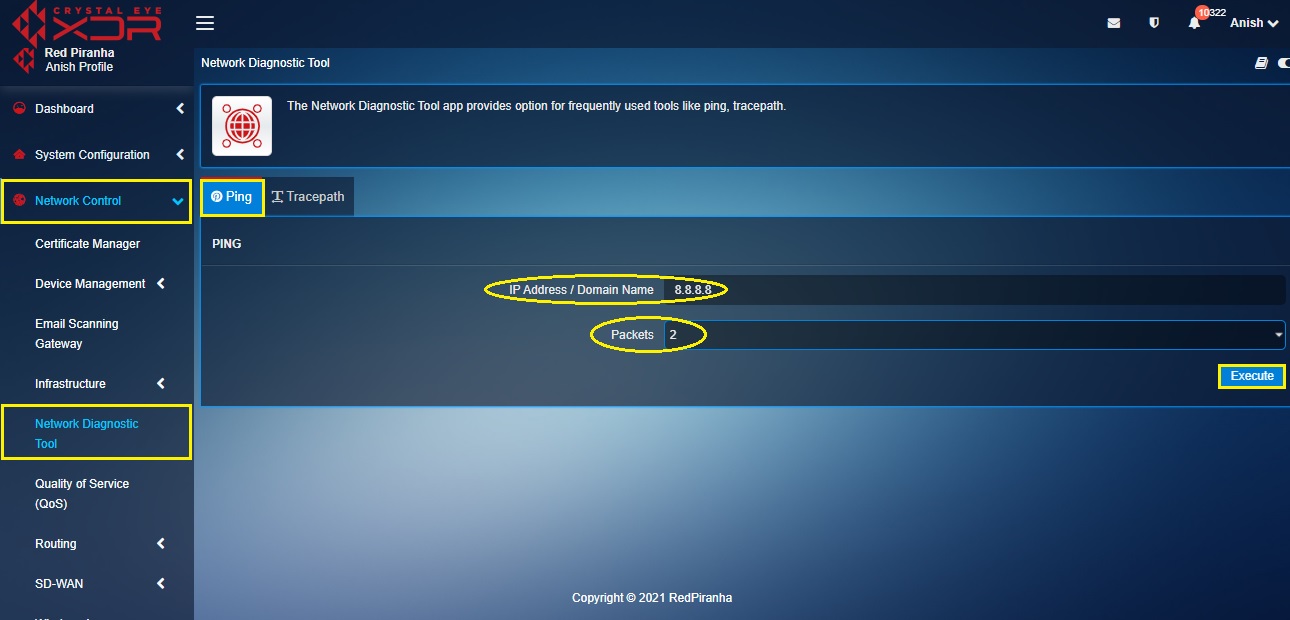
Step 1: In the Ping section, enter the IP address or the Domain Name of the remote host in the IP Address/Domain Name text box, select the Number of Response Packets required from the dropdown and click the Execute button.
Note
The administrator can select the number of response packets to be 1, 2, 3, 4, 5
Tracepath
The Tracepath functionality of the Network Diagnostic Tool app is used by CE XDR administrators to trace the journey of a data that it undertakes to reach the designated destination. This functionality can be used to detect various servers through which the data packet passes and shows each hop in the network. Tracepath scan details can be analysed to identify slow points that affect the network connection and speed in a negative manner.
Note
Tracepath is fundamentally a Linux command. However, an administrator can run a Tracepath command with the help of the Tracepath functionality directly from the graphic user interface of the Crystal Eye XDR.
How to Use the Tracepath Feature of the Network Diagnostic Tool?
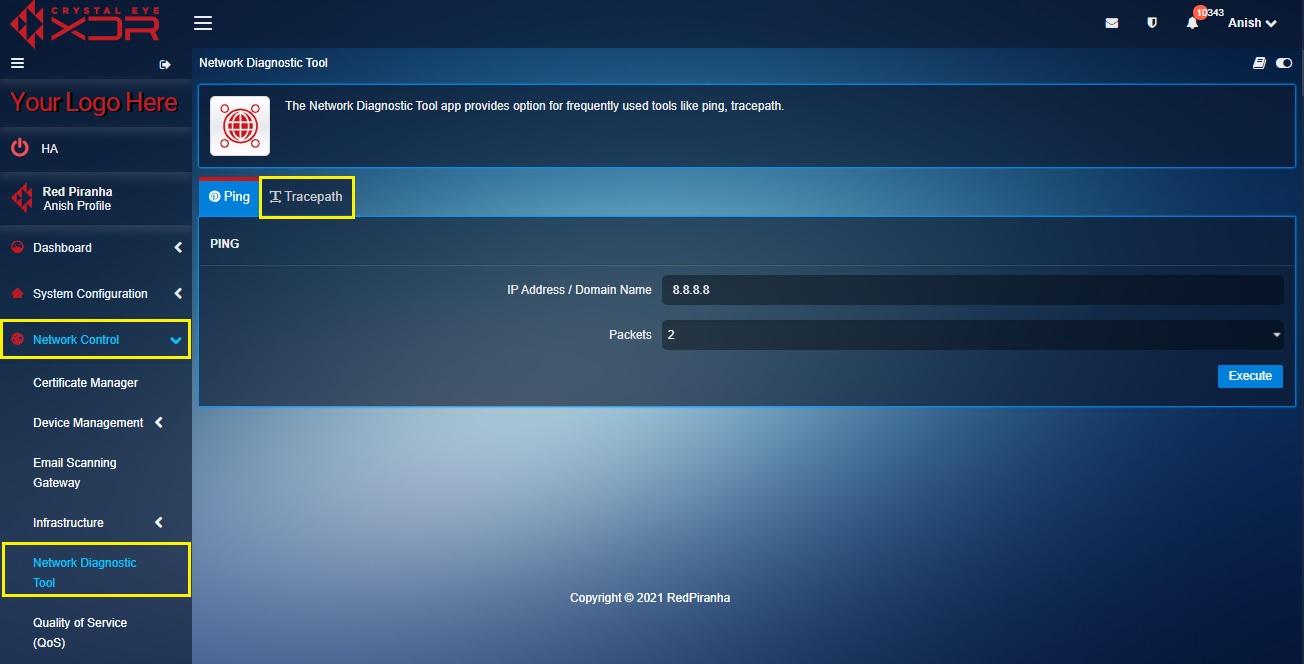
Step 1: In the Network Diagnostic Tool app page, click the Tracepath tab.
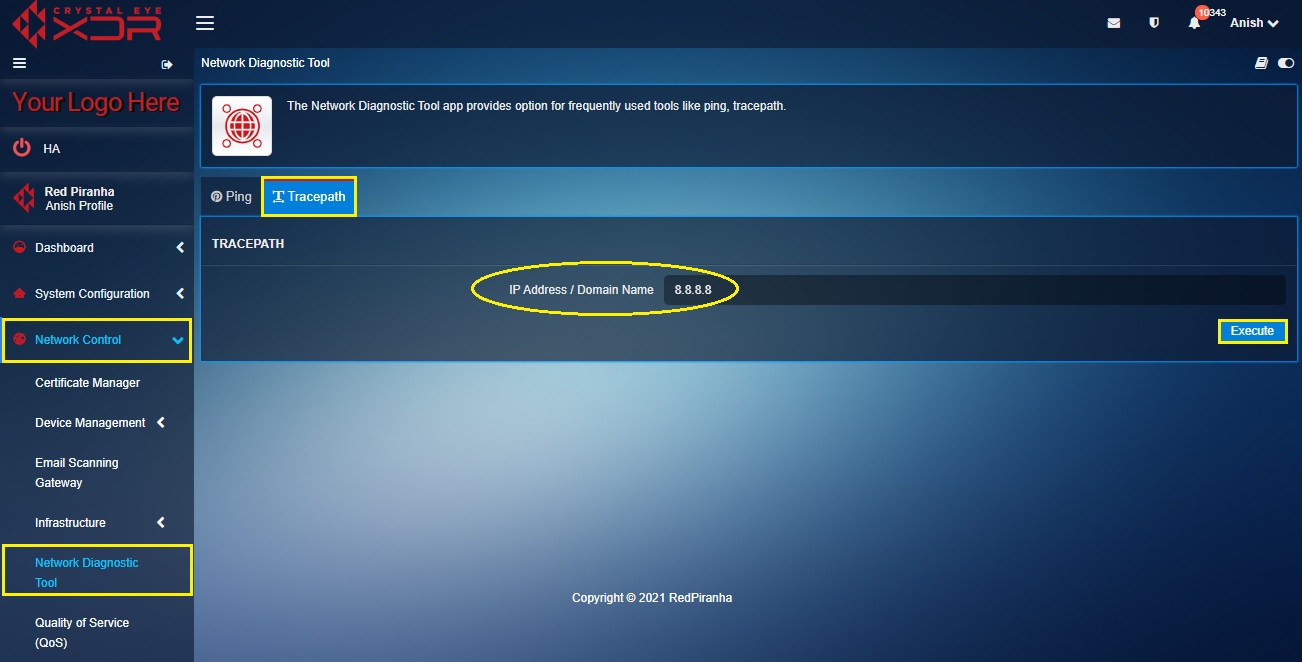
Step 2: You will see the Tracepath page. Enter the destination IP or the Domain Name in the textbox and click the Execute button.


