Threat Dashboard
Overview
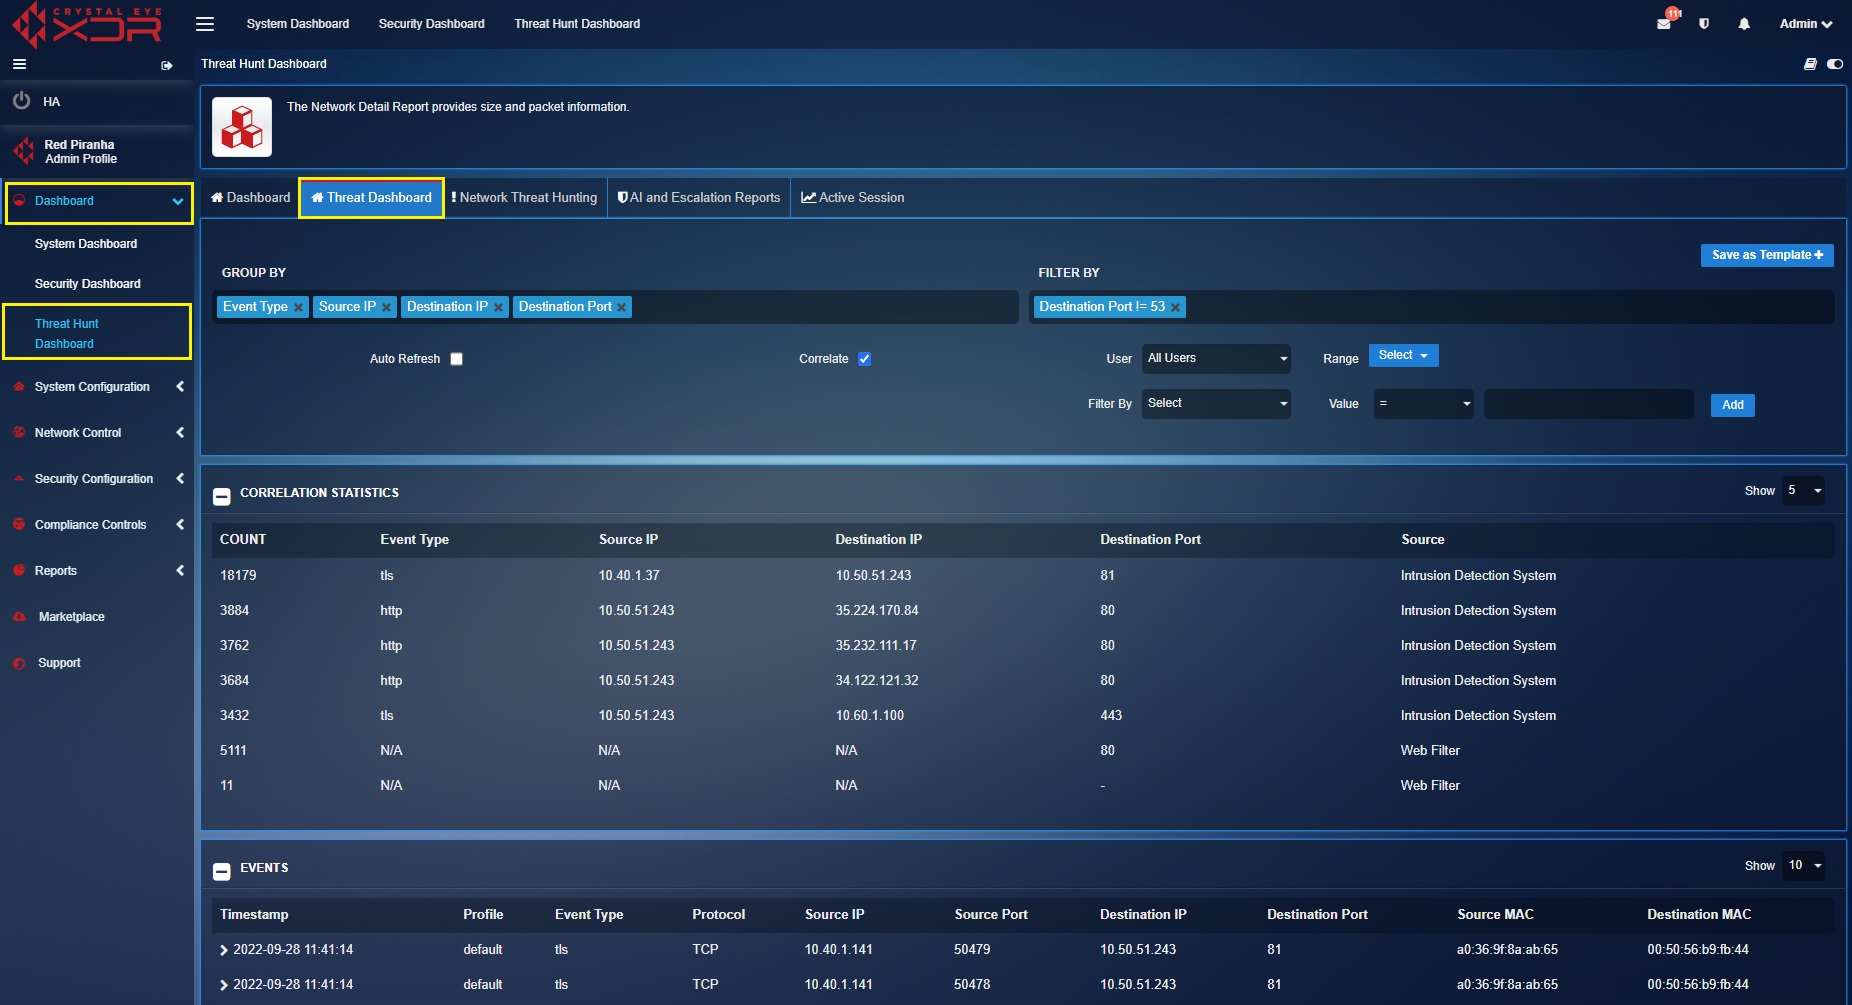
The Threat Hunt Dashboard is a monitoring platform having the ability to detect and respond to the ever-evolving cyber security threats targeted towards the Crystal Eye XDR network.
The Threat Hunt Dashboard provides enhanced visibility into the following aspects of the CE XDR network:
- Events recorded by the Intrusion Detection and Prevention System module of the CE XDR.
- Web Requests made from a particular device.
- Web Requests blocked by the CE XDR’s web filtering module.
- Top Network Users (based on the download and upload size measured in megabytes).
- Top Devices (based on the number of downloaded and uploaded packets).
- Top Network IPs (based on download size and upload size measured in megabytes).
- Top External IPs (based on download size and upload size measured in megabytes).
- Top Protocols (based on the traffic size associated with the protocol)
- Top Device MAC & IP addresses (based on the traffic size associated with the device)
- Top Protocol classification/category based on the traffic size associated with it.
- Top applications (based on the traffic size associated with it)
- All IDPS alerts escalated from the CE XDR.
- All AV alerts in the CE XDR.
- All escalated AV alerts.
- Artificial Intelligence analysis of alerts.
Installation
The entire set of features of the Threat Hunt Dashboard is offered by default and no separate installation is required.
Navigation to Threat Dashboard
Left-hand navigation panel > Dashboard > Threat Hunt Dashboard > Threat Dashboard
Viewing Top 5 Grouped Statistics Data
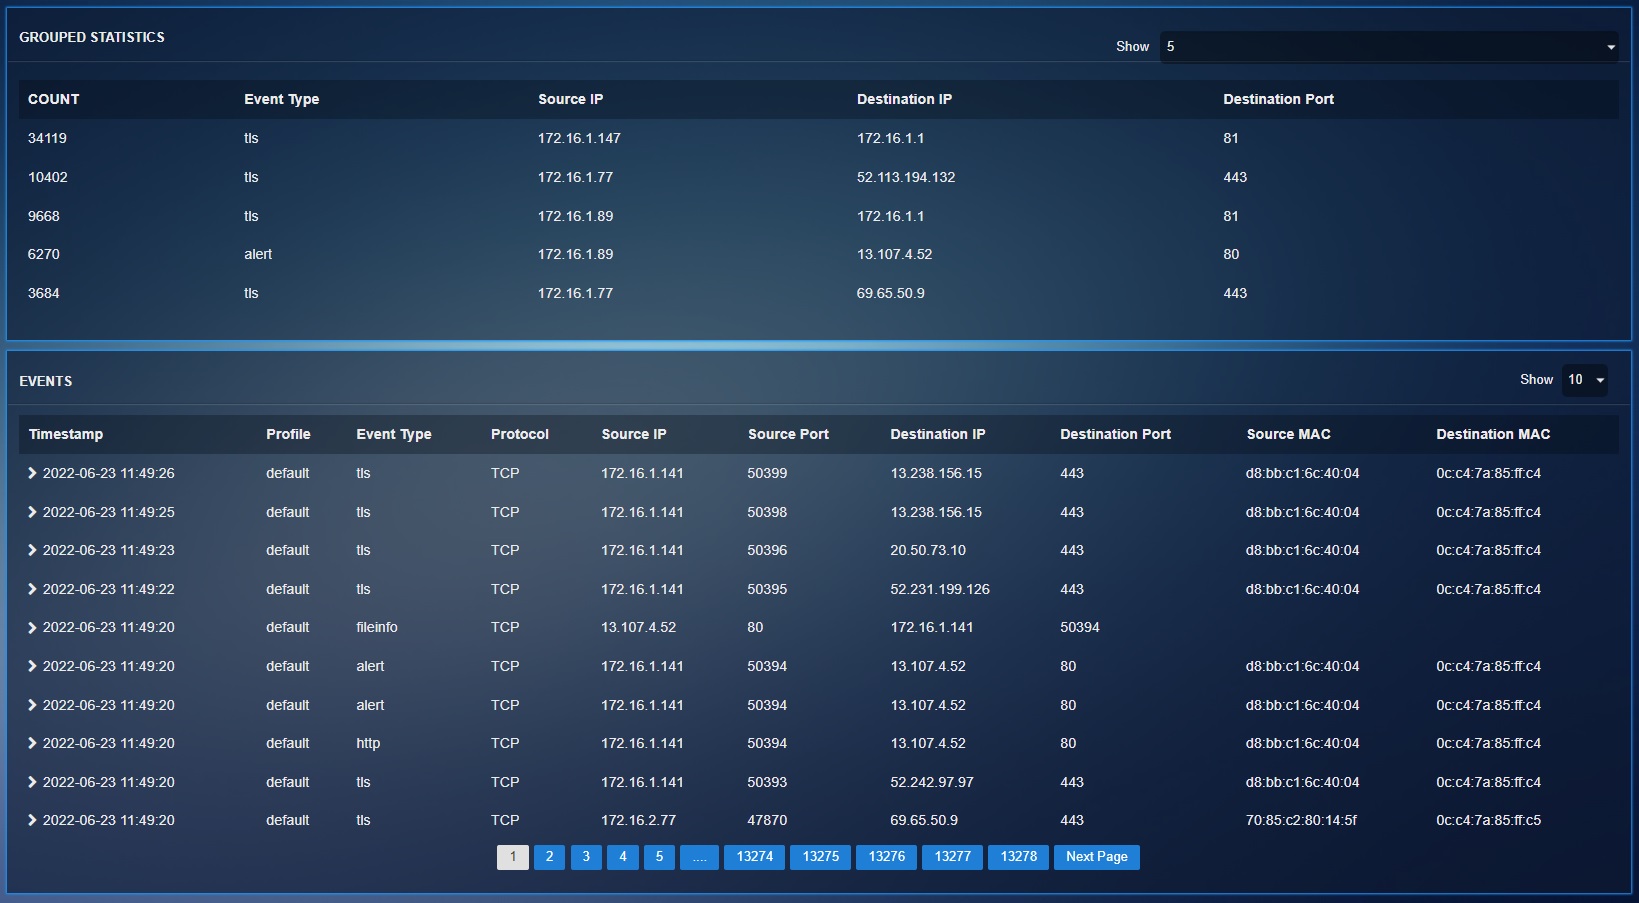
The Grouped Statistics section displays the top 5 event types based on its count. The event type with the highest count tops the chart followed by the other event types with lesser counts.
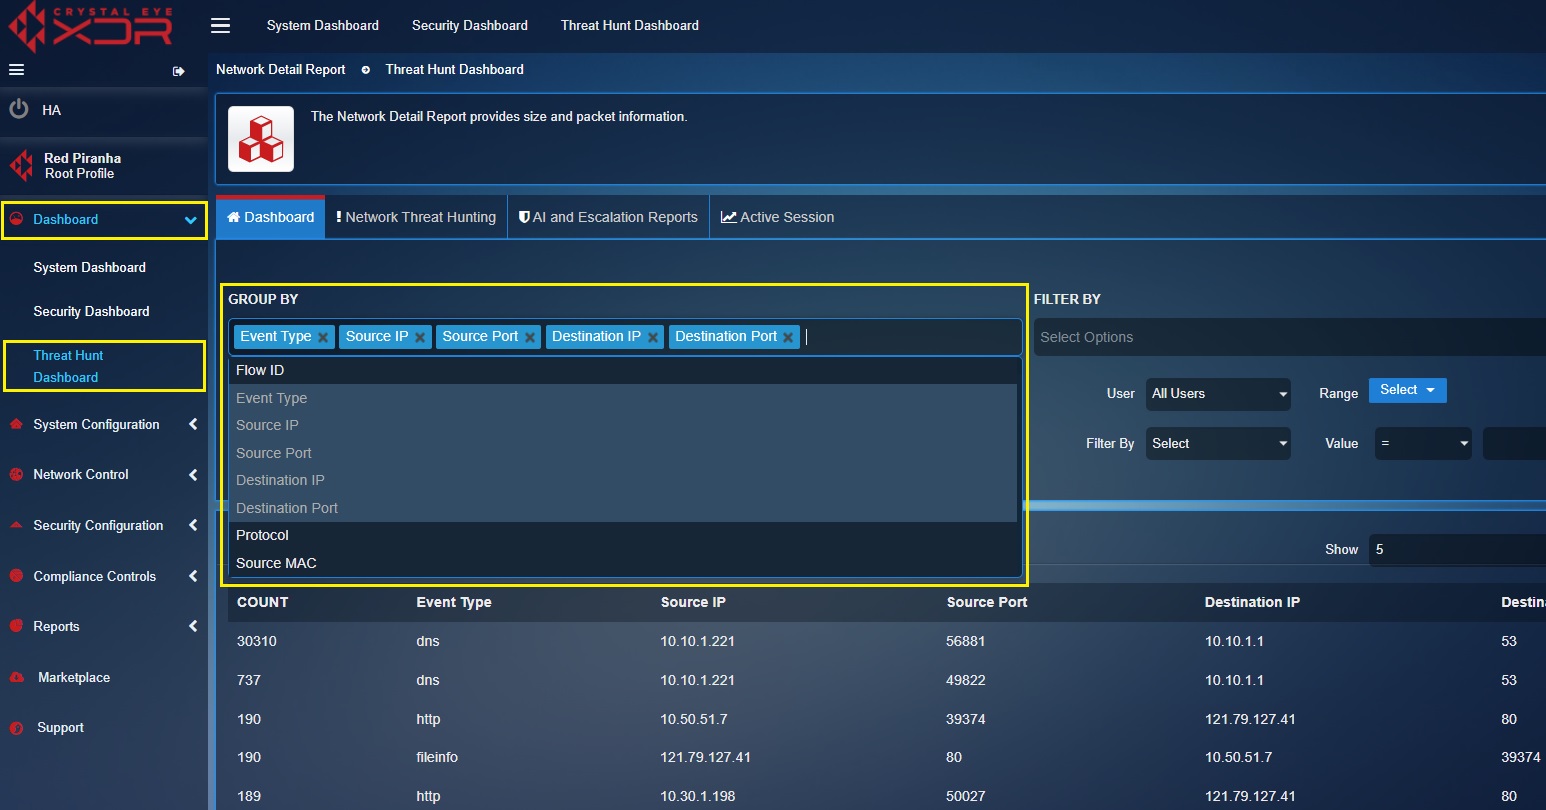
The grouped statistics section shows the top 5 events highlighting its count, event type, source IP, destination IP and destination port. The datasets can be expanded and filtered to display relevant fields providing enhanced visibility for the threat hunting tasks. The following screenshot shows the filter dropdown that can be used to display fields with additional parameters in the Grouped Statistics section.
Viewing Top 5 Correlation Statistics
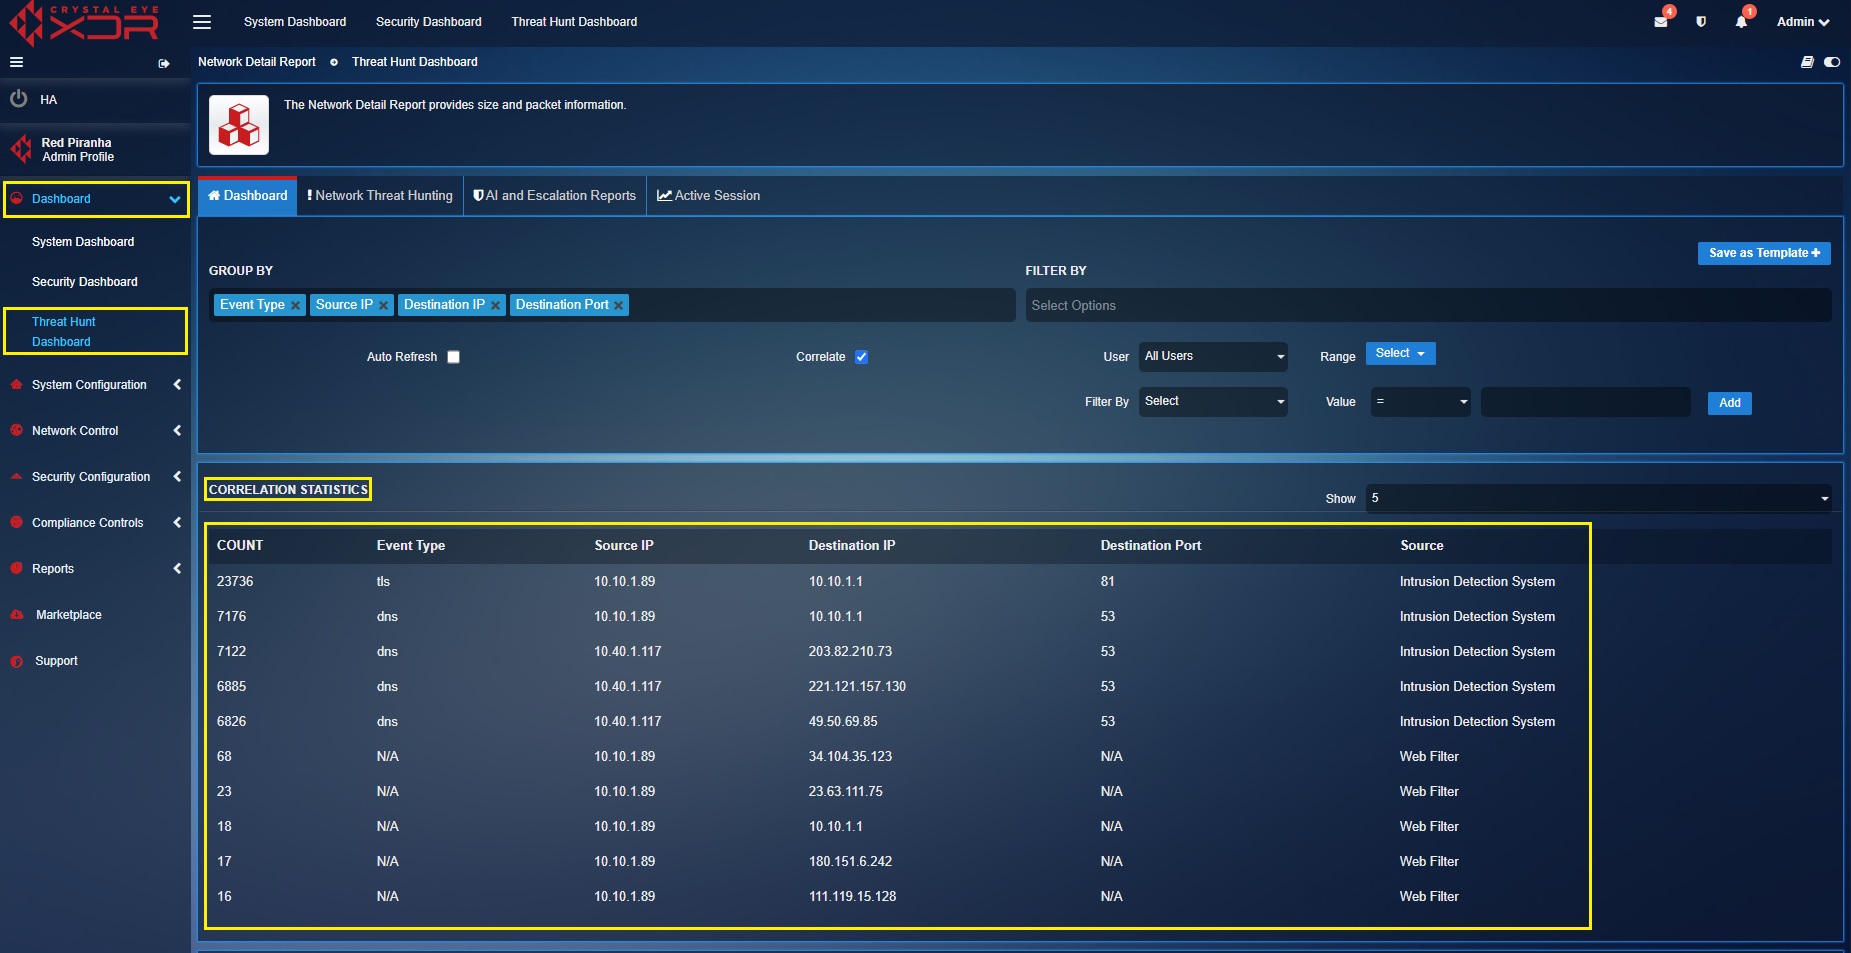
The top 5 correlation statistics displays relationship of the IDPS data with other application data of the CE XDR like web filter. All in all, you’ll be able to view the top 5 IDPS event types and the top 5 web filter data based on the counts recorded by the CE XDR. The screenshot below shows the top 5 correlation statistics of both IDPS data and the web filtering data.
Note
The correlation tick box must be checked to get the Correlation Statistics section to be displayed.
Important
The datasets can be expanded and filtered to display other relevant correlated fields providing enhaanced visibility for the threat hunting tasks. The following screenshot shows the filter dropdown that can be used to display fields with additional parameters in the Correlation Statistics section.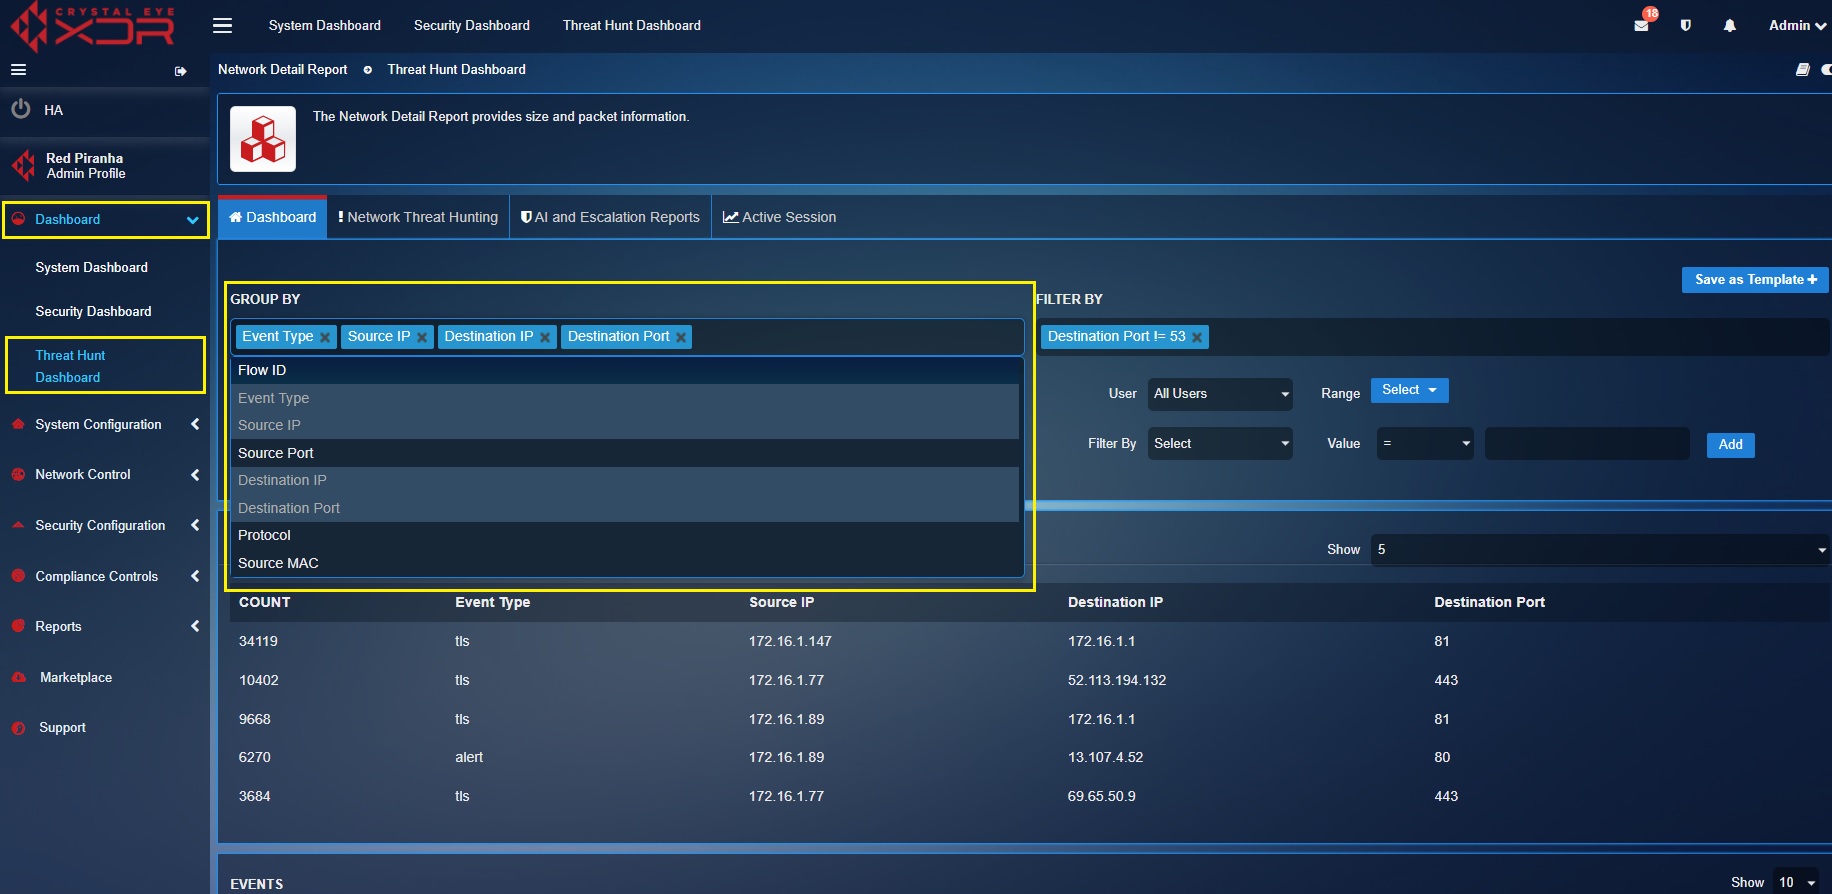
Events—Default Summary View
All the datasets displayed in the grouped statistics and the events sections provides a summary of all the events related data collected by the IDPS module of the CE XDR. The list of fields covered in the summary view of the events by default are as follows:
- Timestamp
- IDPS Profile
- Event Type
- Protocol
- Source IP
- Source Port
- Destination IP
- Destination Port
- Source MAC
- Destination MAC
The screenshot below shows the summary view of the event data discussed above.
Events—Detail View
The data pertaining to all event type can be viewed in the Events section. Each row shows application logs such as Timestamp, Profile, Event Type, Protocol, Source IP, Source Port, Destination IP, Destination Port, Source MAC, and Destination MAC.
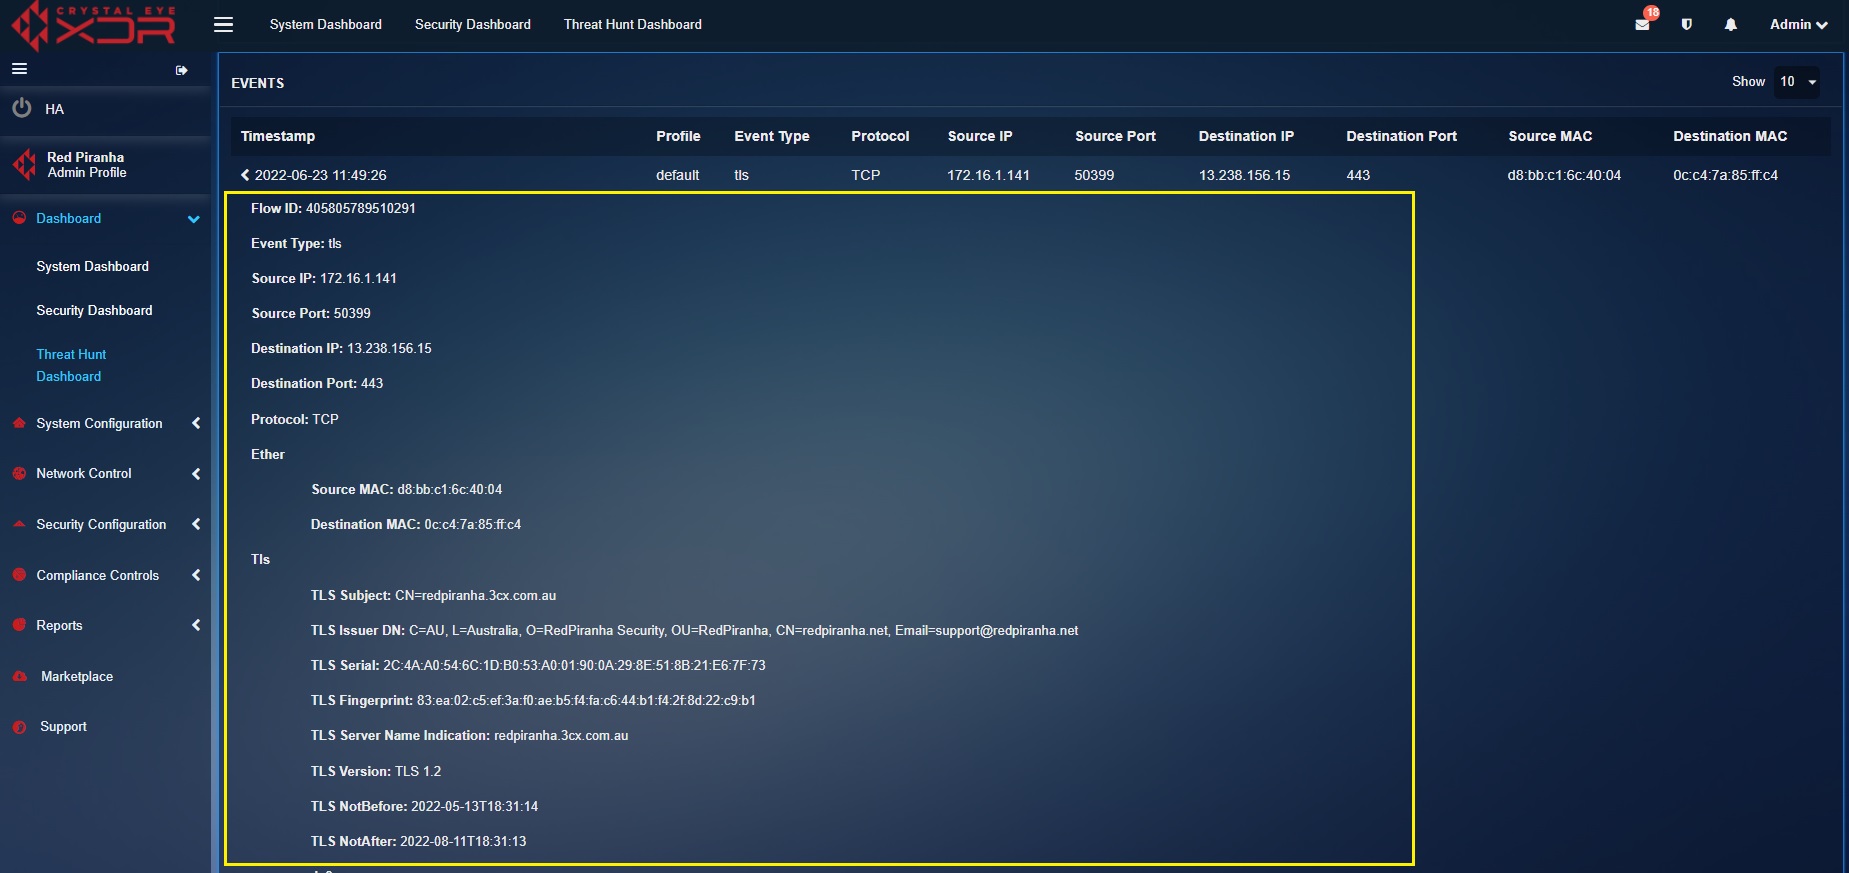
A detailed view of the event data can be viewed by collapsing the rows as shown in the screenshot below.
Note
After collapsing the event row you will see an array of data such as Flow ID, Event Type, Source IP, Source Port, Destination IP, Destination Port, Protocol, Ether, Source MAC, Destination MAC, Tls, TLS Subject, TLS Issuer DN, TLS Serial, TLS Fingerprint, TLS Server Name Indication, TLS Version, TLS NotBefore, TLS NotAfter, Ja3, TLS JA3 Hash, TLS JA3 String, Ja3s, TLS JA3S Hash, TLS JA3S String, Profile, Event Timestamp, iface_alias, Destination Geo IP, Destination Country Code, Destination Country Name, Destination Region Code, Destination City, Destination Postal Code, Destination Latitude, Destination Longitude, Destination Region Name, Destination Timezone, Destination Country Code (3), dest_geoip.updateTime.
Exporting CSV Report
Click the Export button to download the CSV Report of the events as shown in the screenshot below.
Web Requests
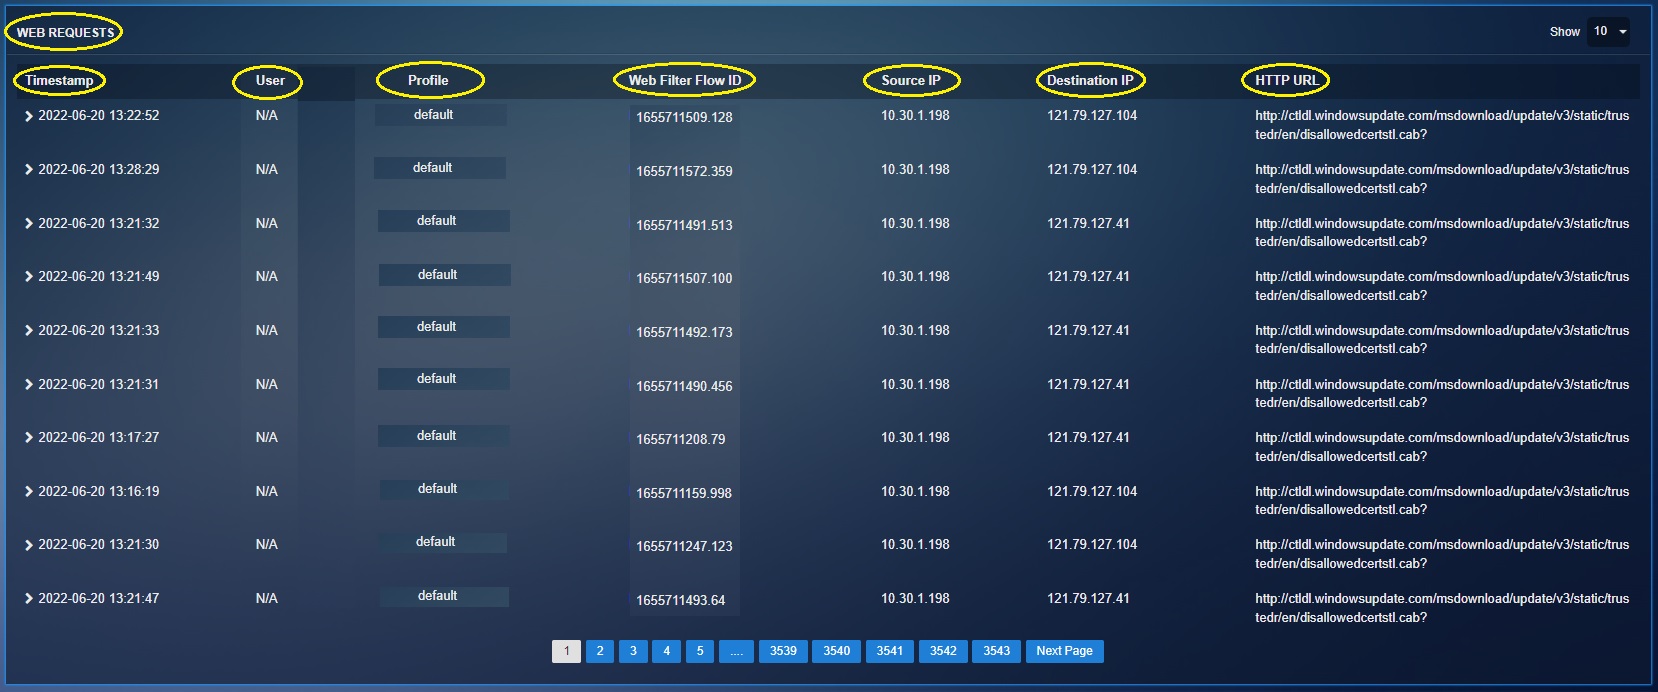
The CE XDR records all the web request raised by users in the network environment and displays it under the web requests section. Each web request recorded by the CE XDR includes the timestamp, associated user, web filter profile, web filter flow ID, source IP, destination IP and the requested URL (see screenshot below).
Note
The CE XDR scans and records http web requests by default. However, if there is a requirement, https web requests can be recorded by enabling SSL decryption in the CE XDR. Know more on how to enable SSL decryption and scan https traffic here.
Important
The web requests section doesn’t appear in the dashboard by default and can be seen on checking the co-relation box (see screenshot below). 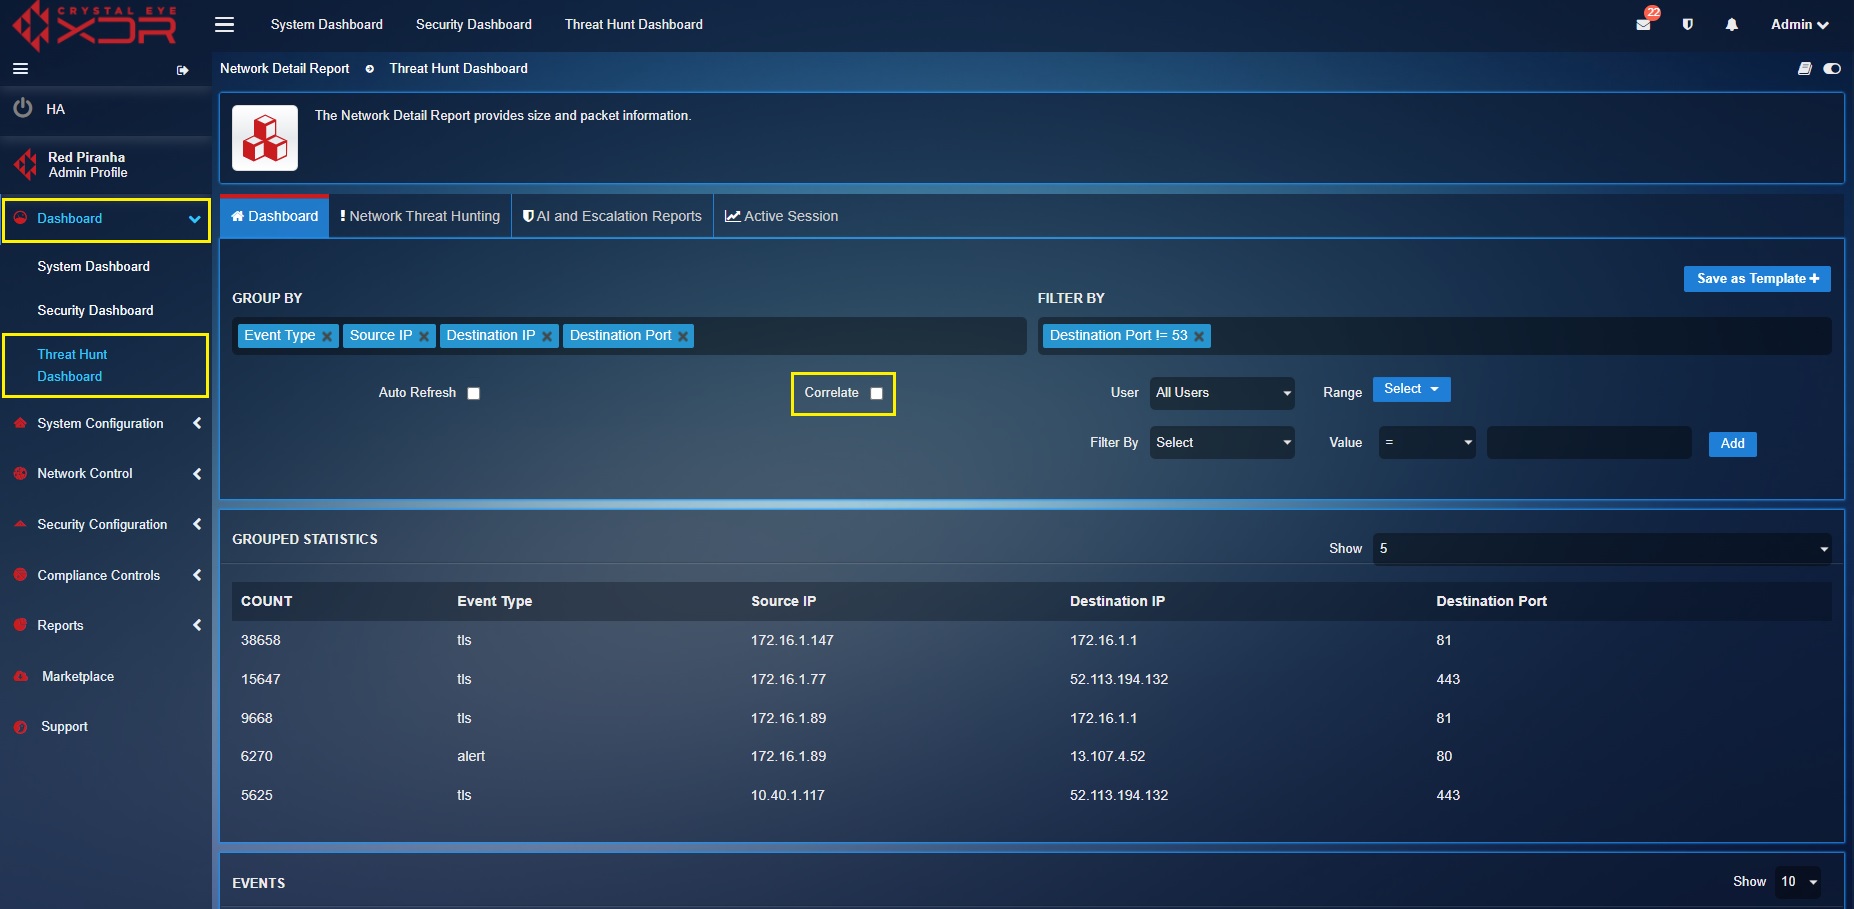
Blocked Web Requests
This section provides visibility of the blocked web requests raised by the devices in the CE XDR network environment. These web requests are blocked as per the web filter policies assigned to the devices in the network.
The screenshot below shows the list of web requests that have been blocked by the CE XDR. Apart from this, the blocked web request section also displays other details related to the blocked web request such as timestamp, user, web filter policy name, web filter flow ID, source IP.
Note
The CE XDR scans and blocks malicious http web requests by default. However, if there is a requirement, https web requests can also be blocked by enabling SSL decryption in the CE XDR. Know more on how to enable SSL decryption and scan https traffic here.
Important
The blocked web requests section doesn’t appear in the dashboard by default and can be seen after checking the co-relation box.
Filtering Based on Groups and Metadata
The entire set of data displayed in the Correlation Statistics section, Events section, Web Requests section and the Block Web Requests section can be filtered using the following four tools:
Group By Filter: This can be used to broaden or narrow down various parameters displayed in the grouped statistics section and the correlation statistics section.
Note
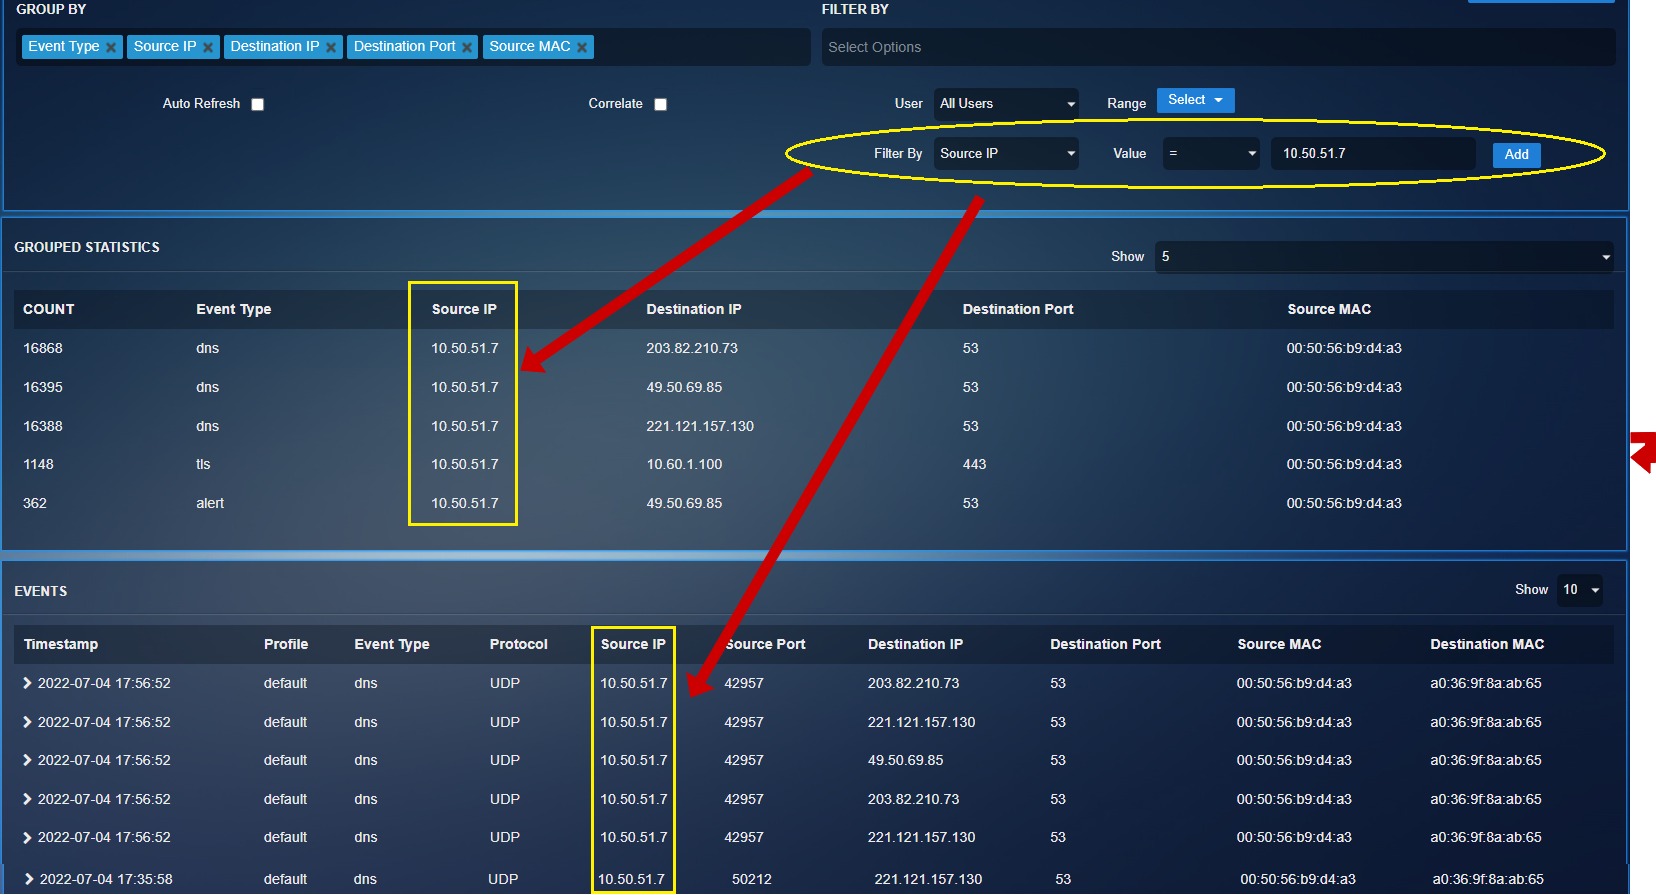
Any additional parameter that you select in the Group By dropdown will get reflected in the grouped statics and the correlation statistics. In the screenshot below we have selected an additional parameter “source MAC” from the Group By dropdown which is reflected in the Grouped Statistics section. 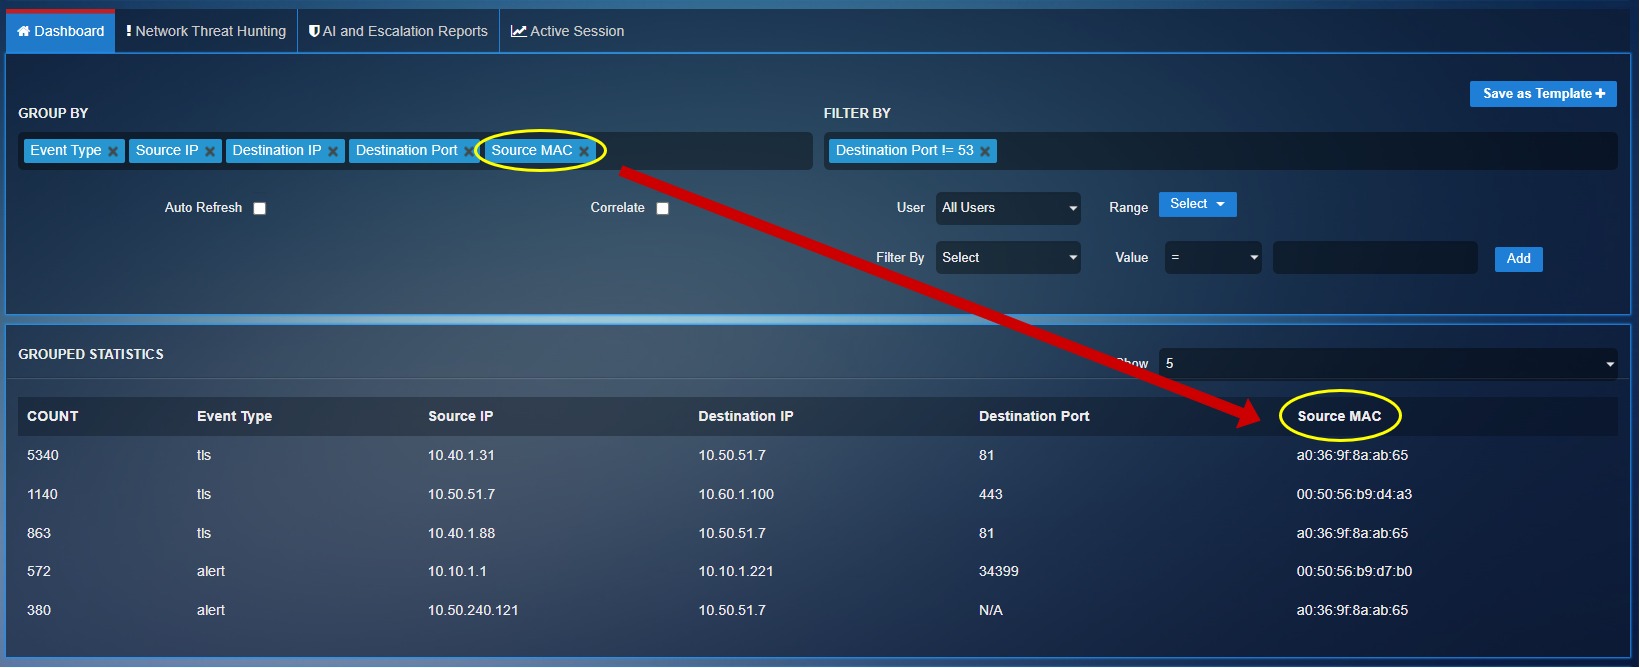
Filter By: This dropdown can be used to select a particular content parameter that you might want to drill down to. For instance, if you want to narrow down the threat hunt to the source IP 10.50.51.7 select Source IP in the Filter By dropdown, enter 10.50.51.7 in the textbox, and click the Add button (see screenshot below).
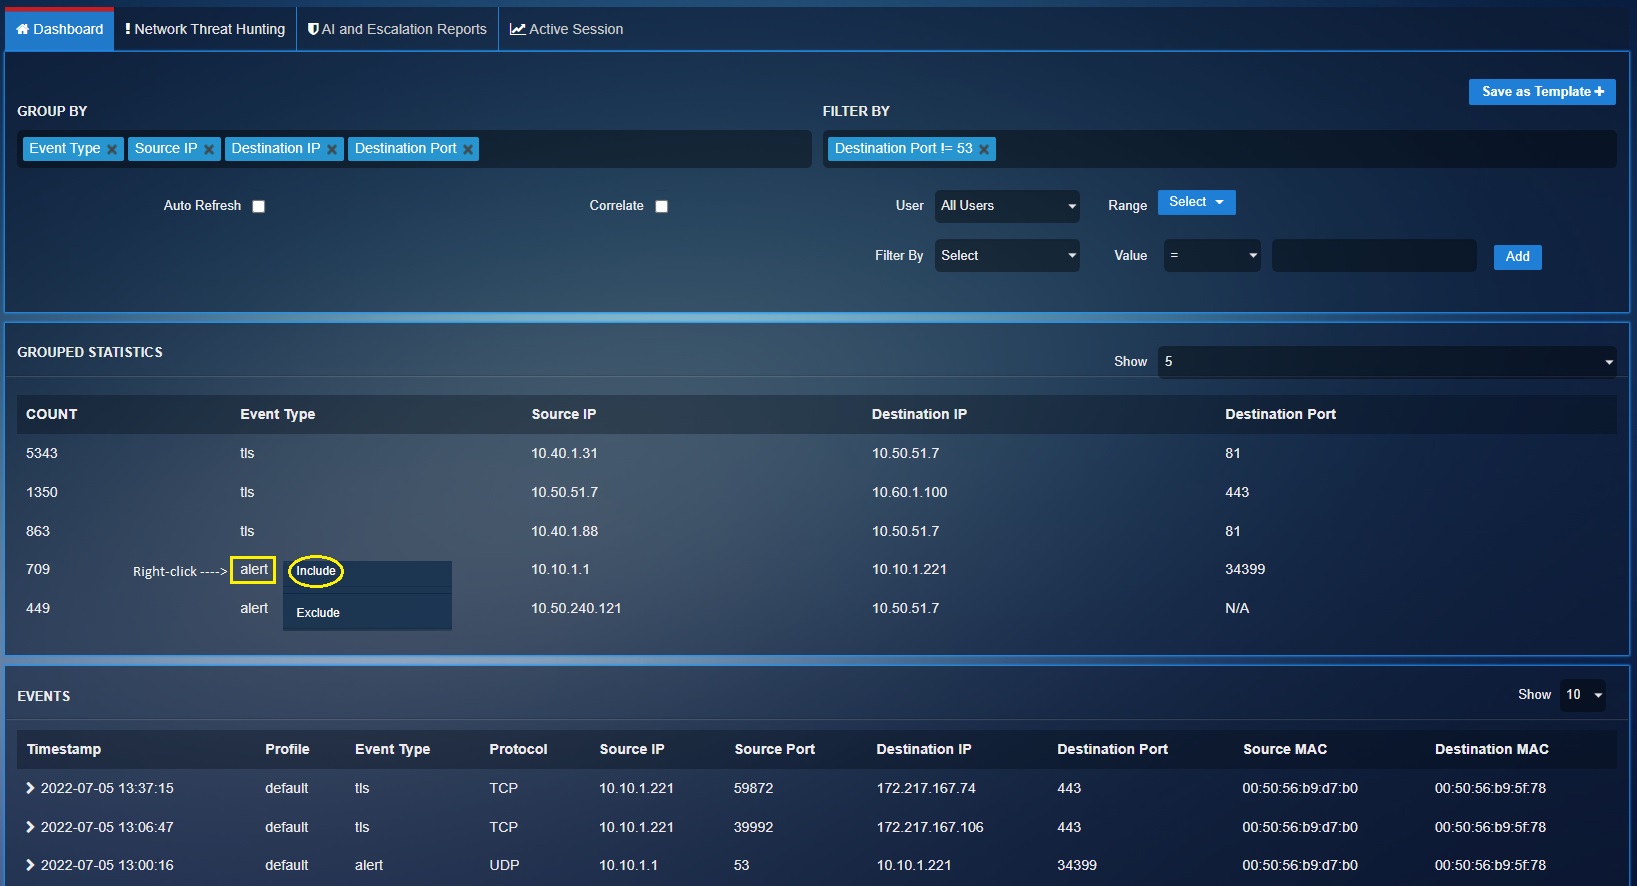
Include function: This feature can be used to drill down to a particular content parameter. Right click on any data displayed on the Grouped Statistics section, Correlation Statistics section and the Events section and the dashboard will transform the data and show relevant statistics related to what was included.
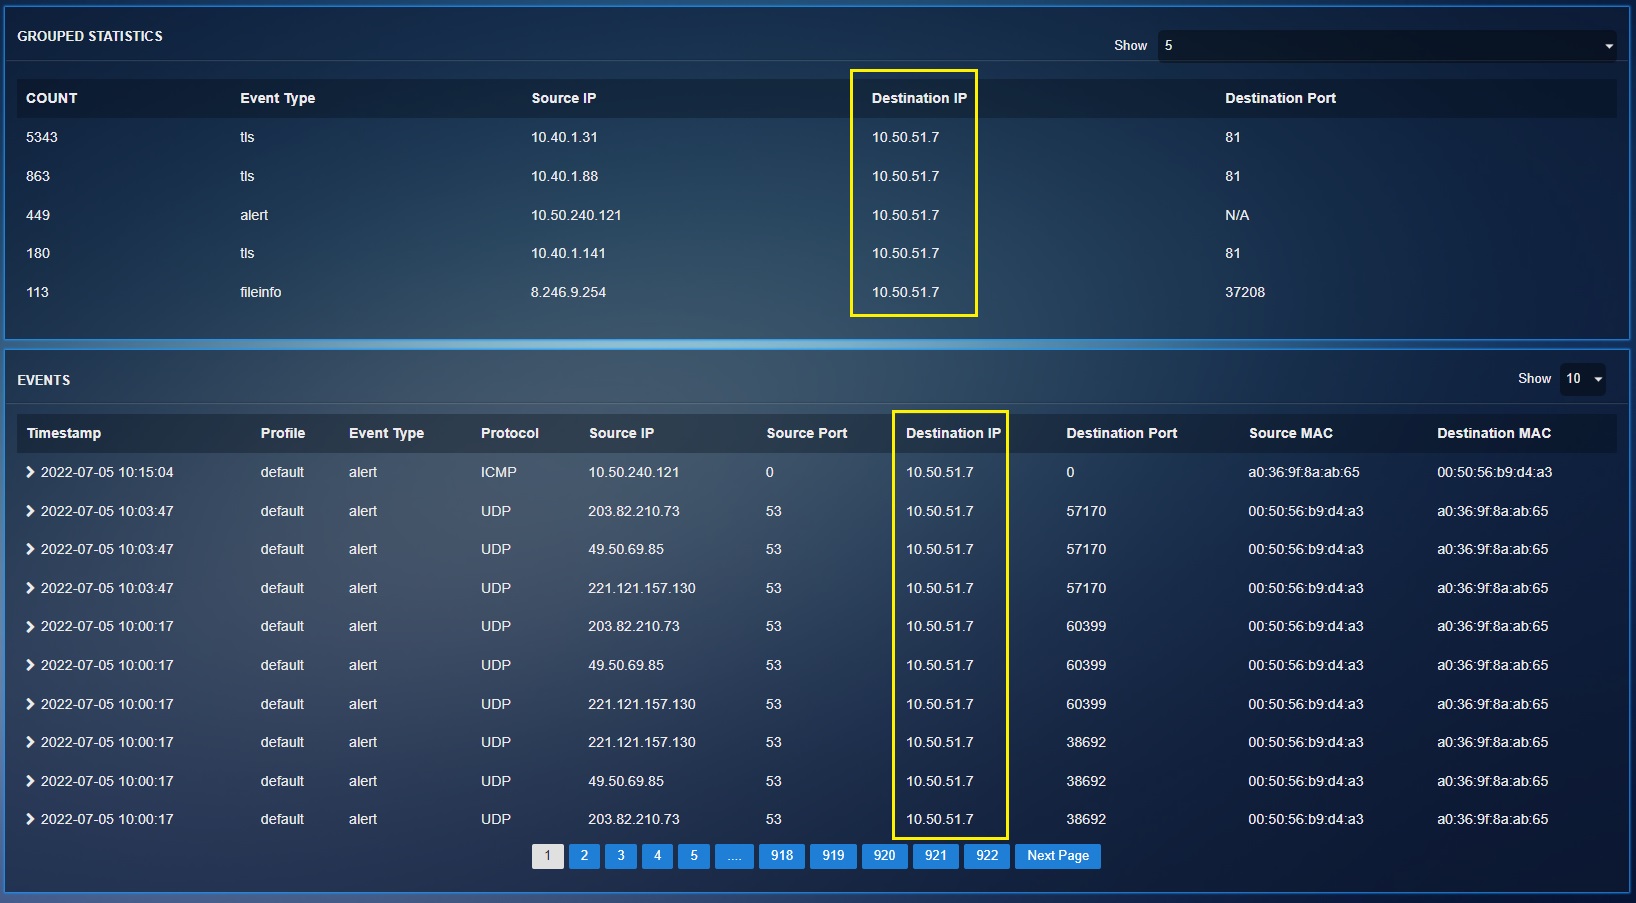
The screenshot below depicts the usage of the include function for the destination IP 10.50.51.7 to tailor the statistics to display only data related to the aforementioned IP address.
The following screenshot shows the tailored report after using the include function to drill down to the destination IP 10.50.51.7
Exclude function: This option can be used to exclude a particular content parameter from the Grouped Statistics section, Correlation Statistics section, Events section, Web Requests section and Block Web Requests section.
The following two screenshots below shows the usage of the Exclude function to eliminate all ‘Alert’ event types. Right click on ‘Alert’ and select Exclude.
The following screenshot shows the tailored report after using the Exclude function to eliminate all ‘Alert’ Event Type from the dashboard.
Configure User Identification and Generate User Based Threat Hunt Dashboard Data
The CE XDR identifies all the devices connected to it and displays it in the Unmapped Network Devices section of the Network Map application. A device can be associated with a user providing a baseline for user-based data in the Threat Dashboard.
Associating a user with a device in the CE XDR network using the Network Map application further helps in associating the Threat Hunt Dashboard data to a particular user.
How to view user-based threat hunt dashboard reports?
Note
In the steps mentioned below we will associate a user ‘Alfred’ to the device IP 10.10.1.89 and then view user-based reports in the threat hunt dashboard.
Step 1: Create a User ‘Alfred’ in the CE XDR with the help of the User application. The screenshot below shows a new user ‘alfred’ created in the User Application.
Note
Read the instructions here to know how to create a user in CE XDR.
Step 2: Go to Network Map application. Left-hand Navigation Panel > Network Control > Device Management > Network Map
Step 3: Scroll down to the Unmapped Network Devices section and click the Map+ button next to the IP address 10.10.1.89 that needs to be mapped to a user.
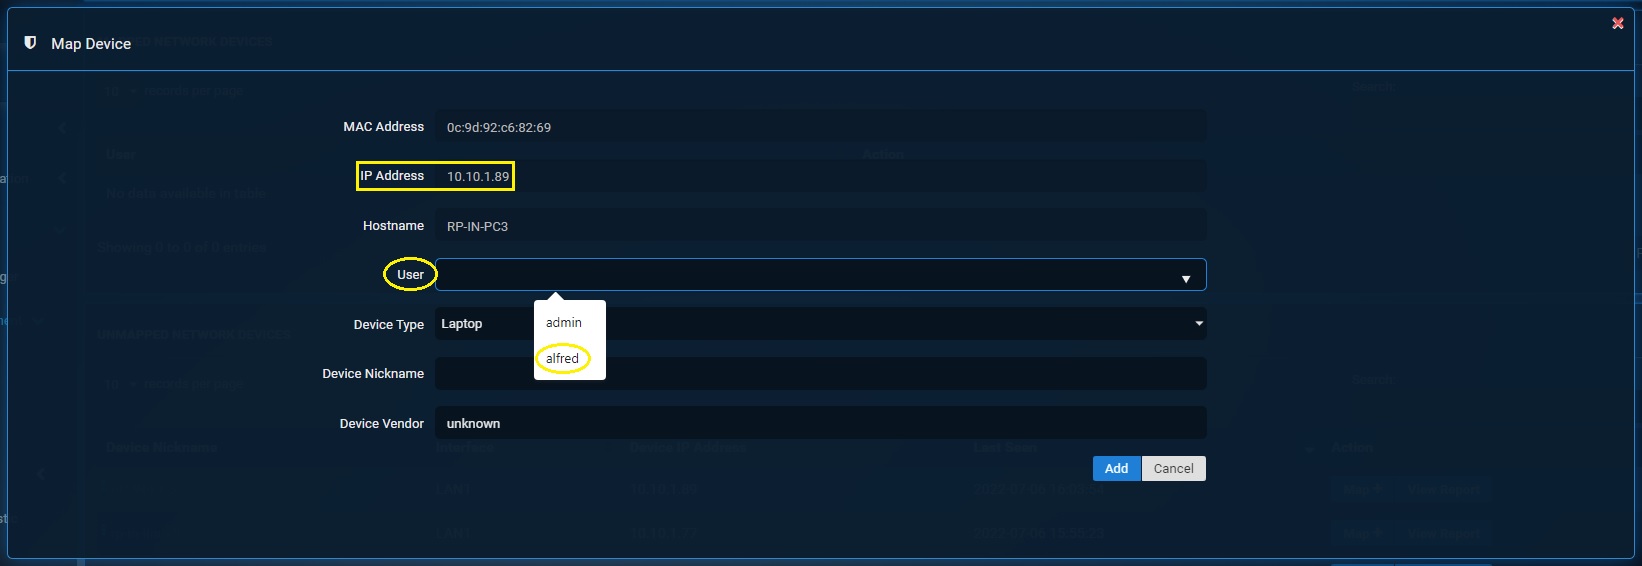
Step 4: You will now see the Map Device section. Select the User dropdown that needs to be associated with the IP Address 10.10.1.89. In our case we will select the user ‘alfred’.
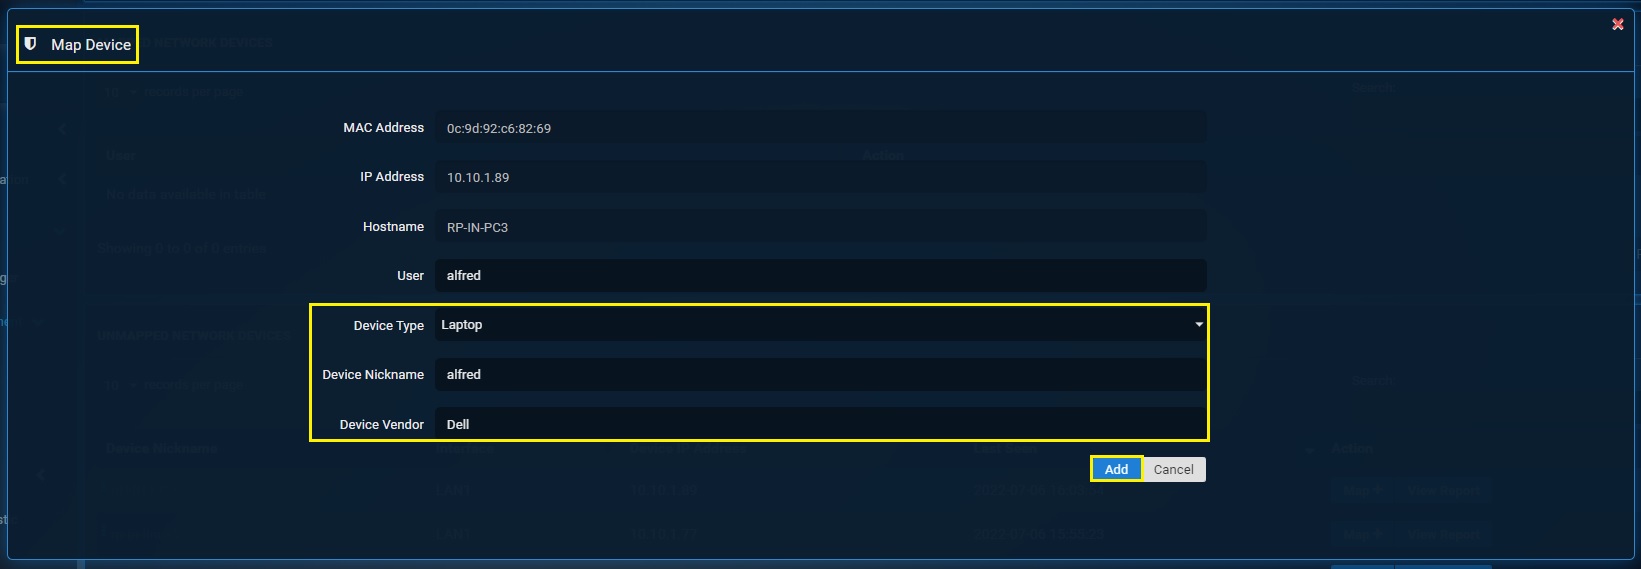
Step 5: Select the Device Type, enter the Device Nickname, enter the Device Vendor Name and click the Add button.
Step 6: You will see the User Alfred mapped with the IP address 10.10.1.89 under the Mapped Network Devices section.
Congratulations! You have now successfully associated IP address 10.10.1.89 with the user ‘alfred’.
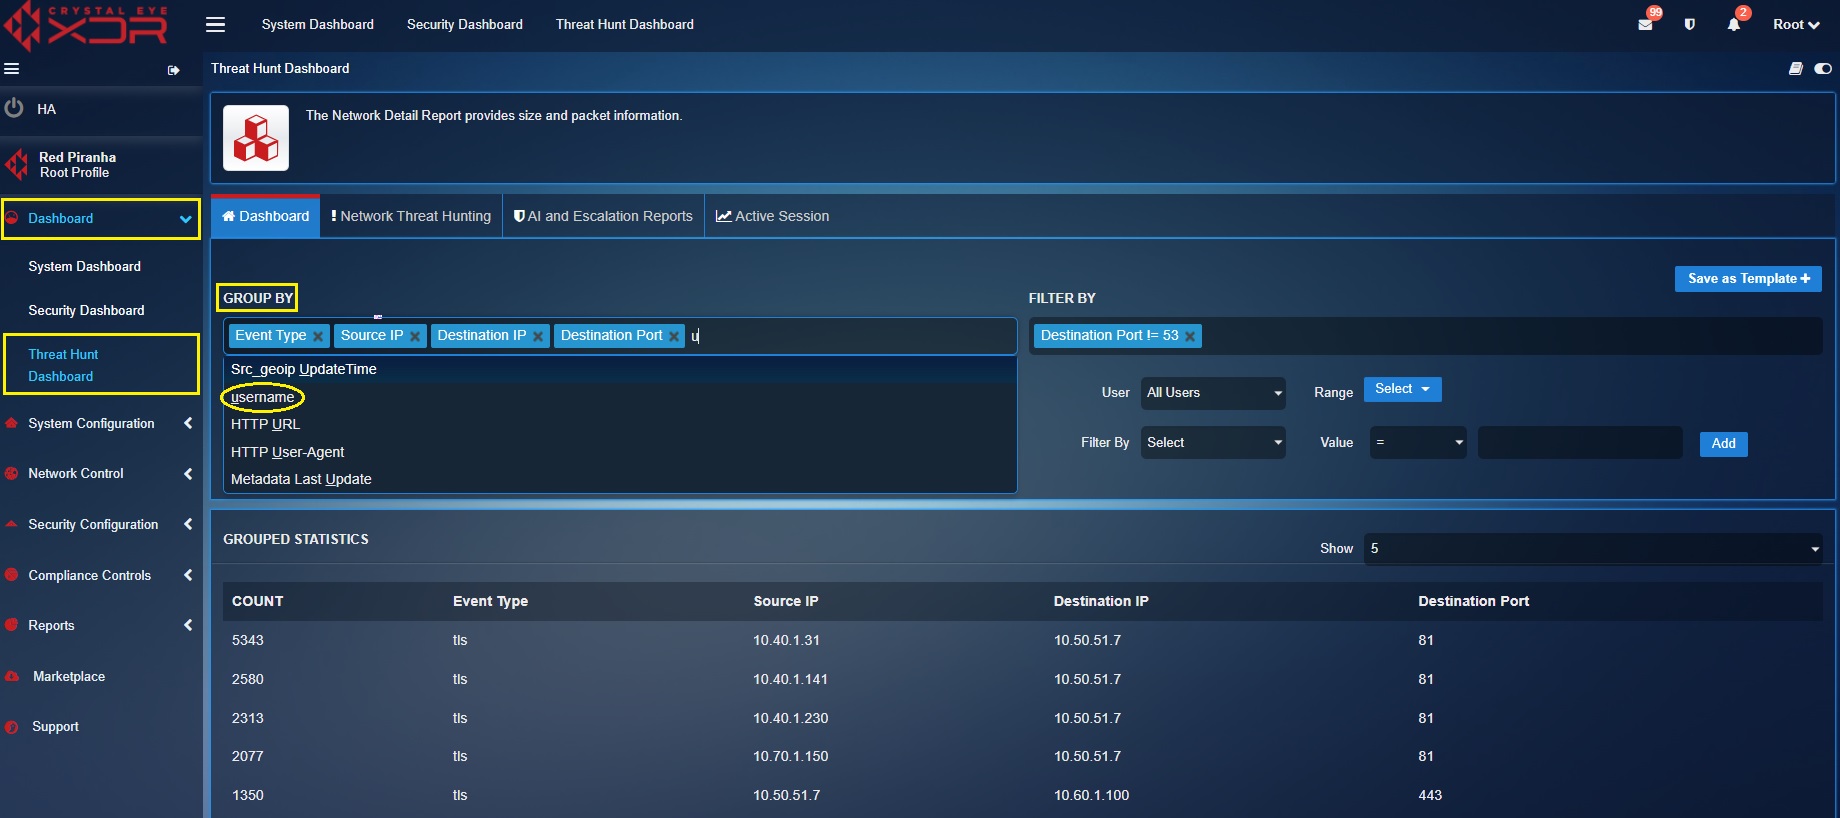
Step 7: Go to Threat Dashboard and select **username from the Group By dropdown.
Note
You will now see the User based reports under the Correlation Statistics section. The screenshots below show’s this section with user-based reports. Correlation Statistics Section Displaying User-based Reports: 
Step 8: Go to Threat Dashboard and select the user ‘alfred’ from the dropdown.

You will now see the User based reports under the Events section, Web Requests section and Blocked Web Requests section. The screenshots below show these sections with user-based reports.
Events Section Displaying User-based Reports:

Web Requests Section Displaying User-based Reports:

Use Case—Hunting for Cyber Threats
Let’s understand how the threat hunt dashboard can be used to hunt trickbot malware in a device connected to the CE XDR with the help of the use case below.
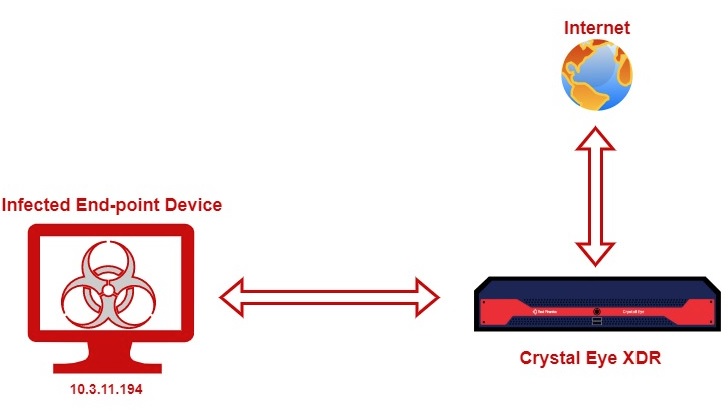
A device with the IP address 10.3.11.194 is connected to the CE XDR (as shown in the diagram below)
In our case, we will use the threat hunt dashboard to:
- Scan the available metadata
- Identify the affected device
- Detect suspicious activities in the network
- Associate it with the trickbot malware
Note
TrickBot is an advanced banking trojan that attackers can use to steal payment credentials from the victim’s device or network.
The threat hunt expedition to identify tickbot malware activities has been enumerated below:
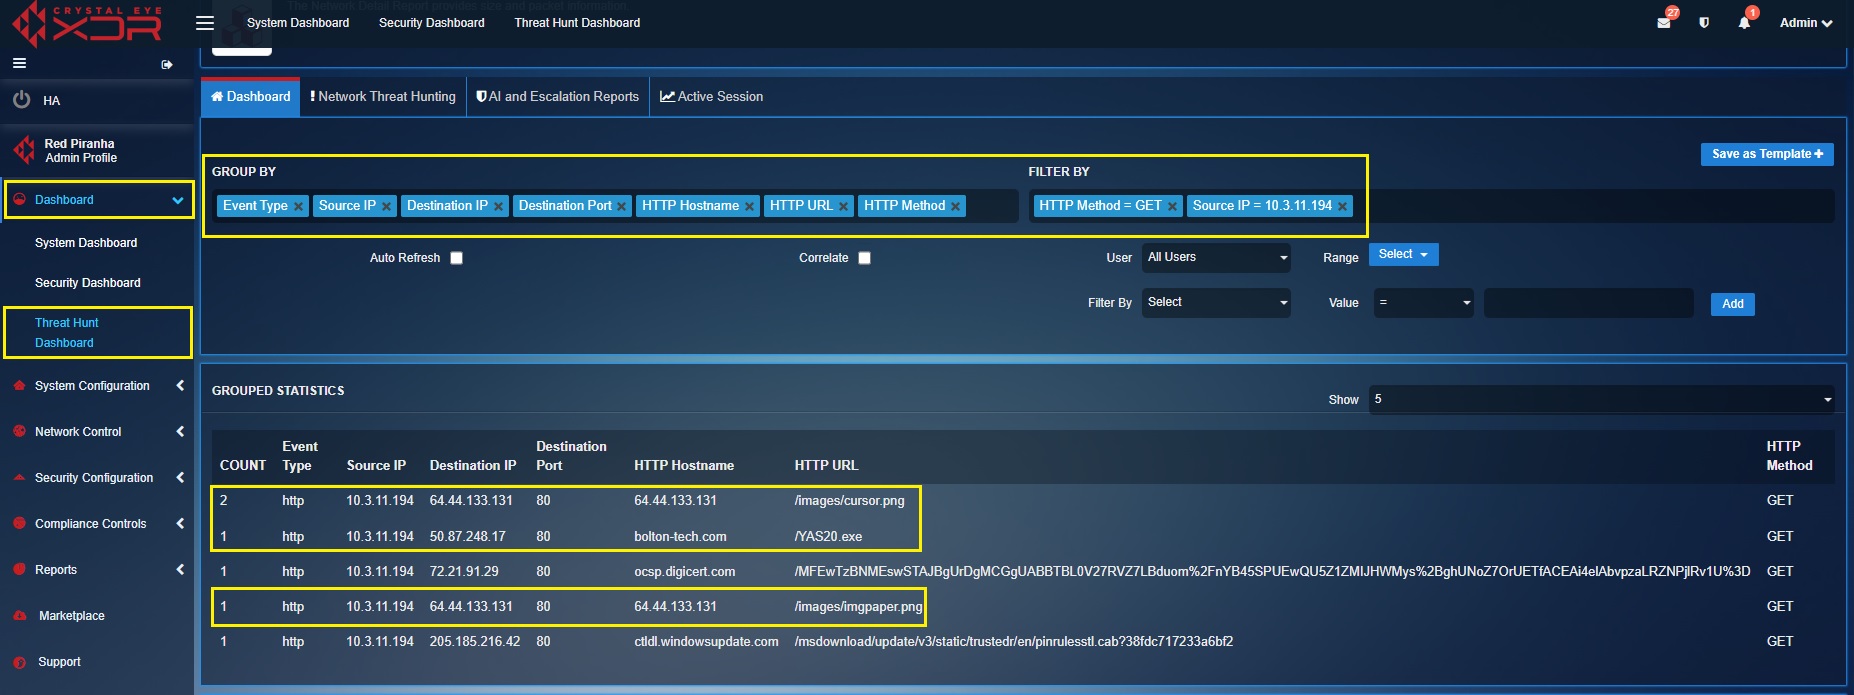
[A] Identifying unusual HTTP GET requests (Initial Infection Activity): HTTP Get requests allows users to grab data from a data source. However, unusual HTTP GET requests might provide more information of the infected network and device. In this threat hunt activity task, we will try and lookup for HTTP GET requests for malicious HTTP Hostname (bolton-tech.com) and HTTP URL (/YAS20.exe) known to be associated with the trickbot malware. We will also try and find out the URL of the PNG file that was clicked by the target user. All these activities are categorised as initial infection activities.
Below are the filters that are applied to identify initial infection activities.
In the screenshot above, the highlighted data in the Grouped Statistics section shows abnormal HTTP GET requests.
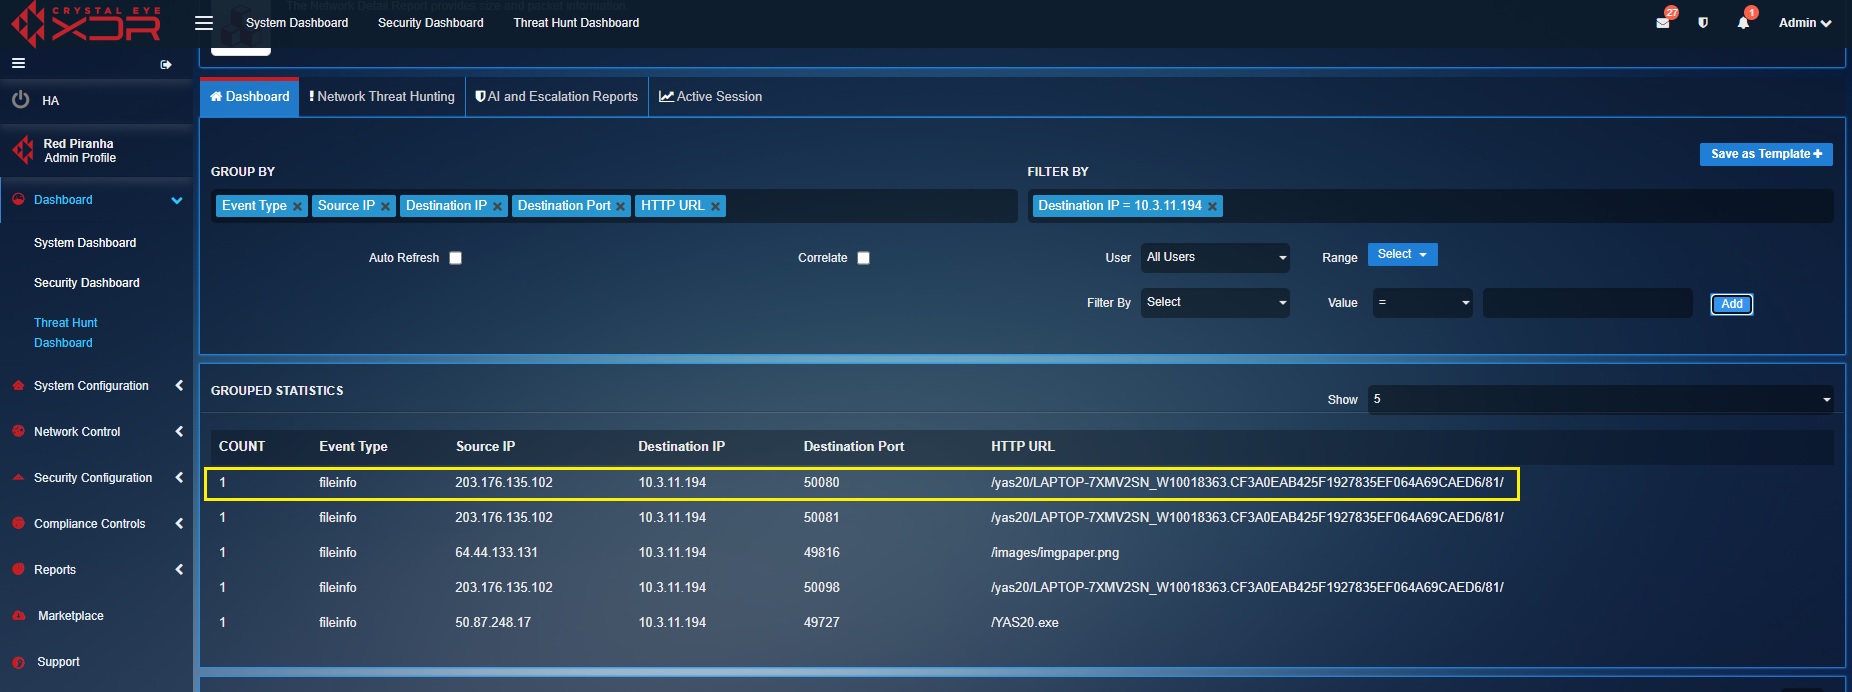
[B] Drill down to the infected device (10.3.11.194): Below are the filters applied to drill down to the infected device and know its hostname.
From the highlighted data above we shall get to know the hostname of infected device from the URL i.e LAPTOP-7XMV2SN
[C] Metadata & details of infected host: Since we already know that the URL /YAS20.exe is suspicious. We shall use filters to find events with the HTTP URL as /YAS20.exe. This way we’ll be able to scan the metadata and get the details of the infected hosts.
The screenshot below shows the metadata revealing more information of the infected host.
The following are the details of the infected host and file displayed in the screenshot above:
DETAILS OF INFECTED HOST: Host name: LAPTOP-7XMV2SN Host MAC address: b8:ca:3a:ec:3b:8f Host IP address: 10.3.11.194
DETAILS OF INFECTED FILE: File location: http://bolton-tech.com/YAS20.exe File size: 466944 bytes File description: initial windows executable file for Trickbot
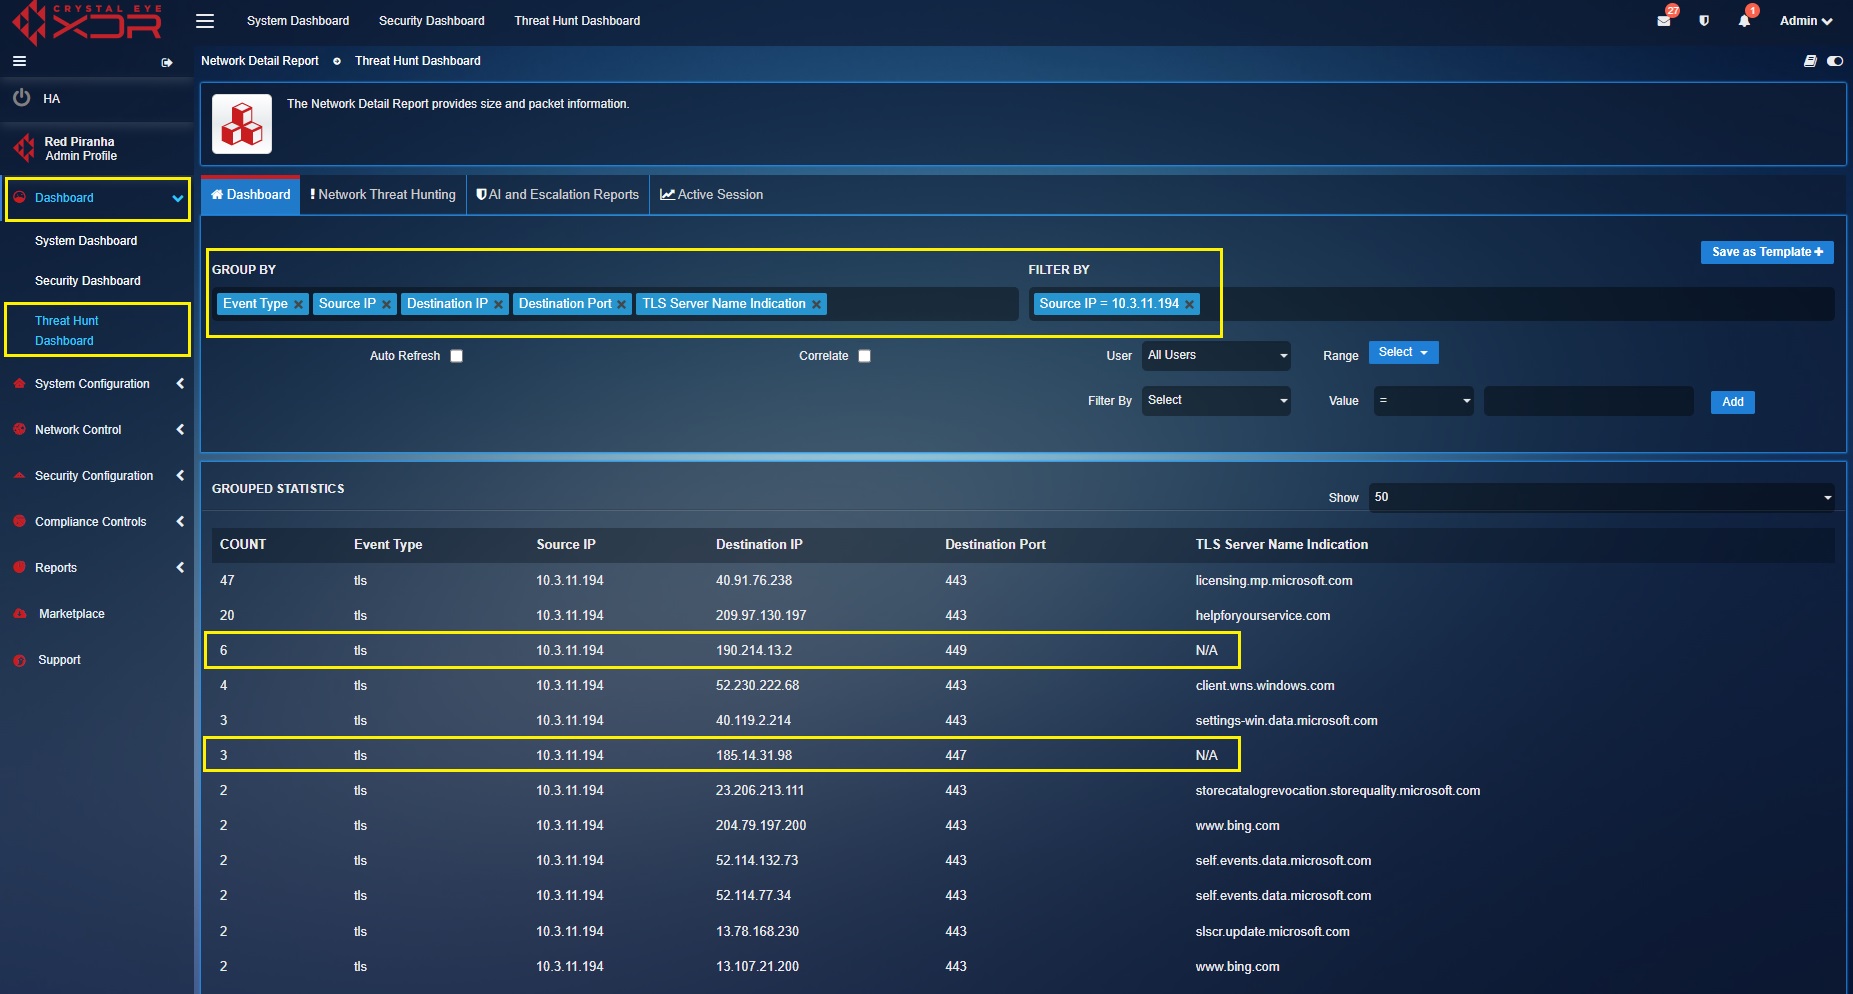
[D] Observing post infection activities: The post infection activities in this case shows communication of the infected host with the C&C server having no domain names. This information can easily be attained by filtering the data by the infected host IP address and TLS name server indication
