Event Last 24 Hours
Overview
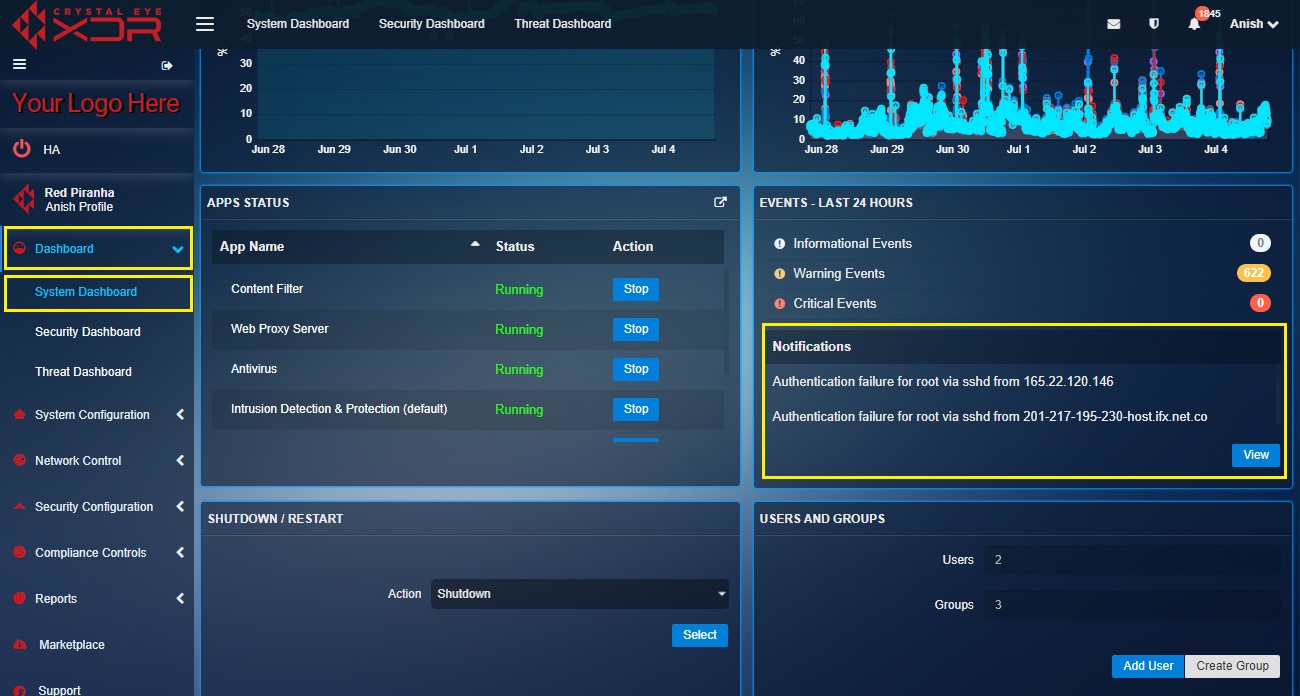
The Event Logs widget provides real-time information about various types of system events occurred in the Crystal Eye XDR on-premise network over the past 24 hours. The widget has a dedicated overview section that displays all CE events and categorizes it as Informational Events, Warning Events and Critical Events. The Notifications section displays an elaborative format of the event specifying the event type and the IP address associated with the event.
How to View Events/Logs Details & System Generated Notifications for the Past 24 Hours?
Step 1: In the Events Logs widget, you will be able to view the total amount of Informational Events, Warning Events and Critical Events (refer to the screenshot below).
Step 2: Now use the scroll bar to view all the notifications that have popped-up in the past 24 hours.
How to Fetch a Detailed Report in PDF Format that Provides Information of Various Events/Logs?
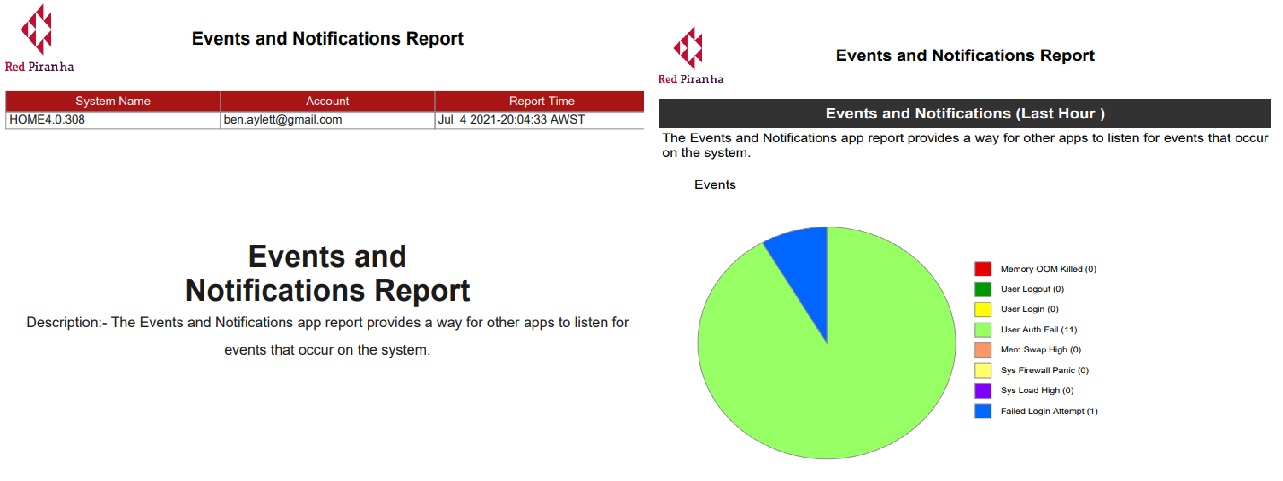
As discussed above, the Event Logs widget provides real-time information about various types of system events occurred in the Crystal Eye network over the past 24 hours. However, CE administrators can gain access to a comprehensive PDF report that provides information of the various events logged by the Crystal Eye appliance. The two types of reports generated by CE here are the consolidated report and the regular report. The consolidated report shows a pie chart denoting various event types, where as the regular report shares information about each Event Type, Event Description and the Timestamp in tabular format.
Step 1: In the Events Logs widget, click the View button at the bottom right corner of the widget.
Step 2: You will now be directed to the Events and Notification application page. Click Export Consolidated Report as PDF button.
Step 3: Select the time period for which the report is to be generated.
The PDF document of the report will now open on your browser. As highlighted in the screenshot below, there are 8 different event types that can be triggered and denoted in the consolidated report pie chart. The event types that are highlighted and flagged here are Memory OOM Killed, User Logout, User Login, User Auth Fail, Mem Swap High, Sys Firewall Panic, Sys Load High and Failed Login Attempt. The date and time at which the report was downloaded is a also displayed in the top-right corner of the PDF report.


