Process CPU Usage
Overview
The Process CPU Usage widget offers a graphical representation of various procedural work handled by the Central Processing Units of the Crystal Eye XDR on-premise. The administrator can use the widget to know CPU Utilization Percentage of all the 4 CPUs and the average utilization percentage of all the CPUs. Some of the major procedural works handled by the CPUs of the Crystal Eye appliance are related to CE Dashboard, Log Reporting, IDS & IPS, Console Terminal etc.
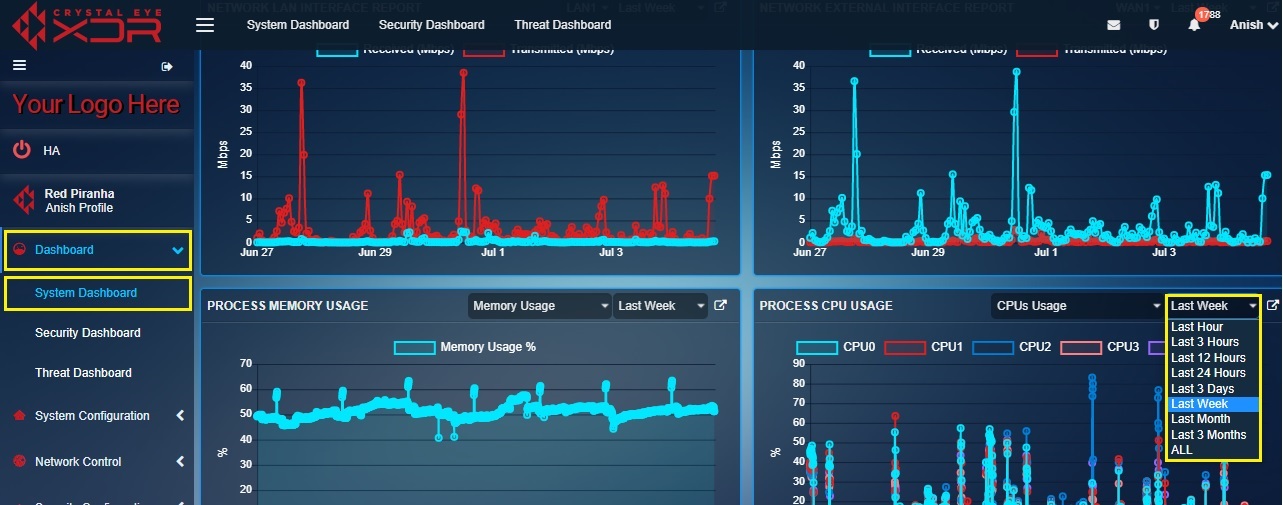
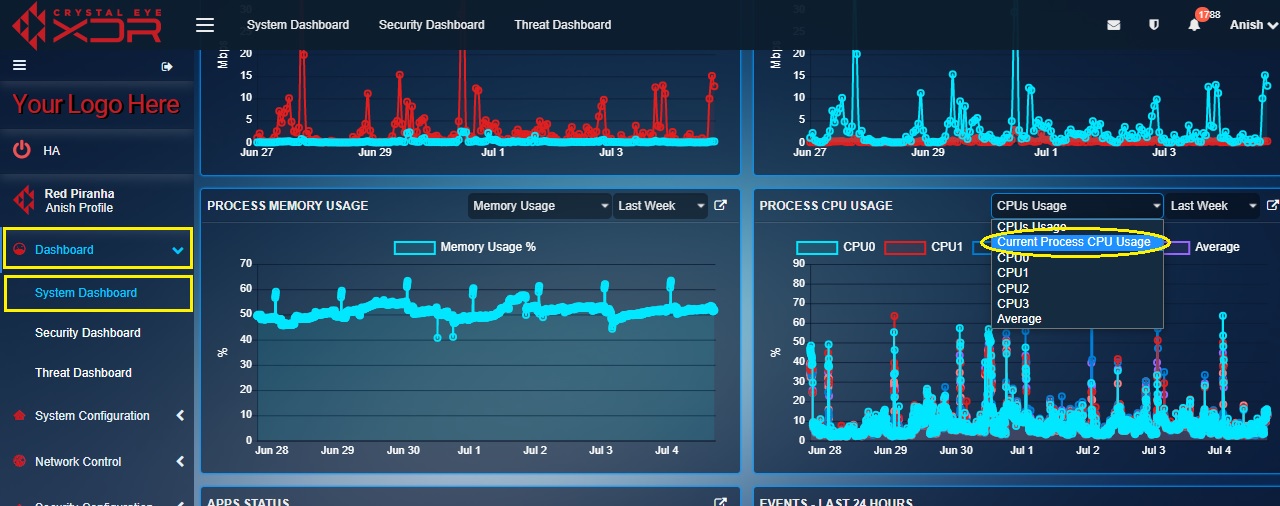
The Process CPU Usage widget has a switch functionality that can be used to view both CPUs Usage which is the CPU usage percentage and Current Process CPU Usage (Refer to the screenshot below)
What is CPU Usage? How to Interpret the Graphical Data Displayed in the CPUs Usage Graph?
Crystal Eye has multiple CPUs that perform procedural works related to CE Dashboard, Log Reporting, IDS & IPS, Console Terminal etc. The CPU Usage widget displays graphs that show utilization percentage of each CPU in the Crystal Eye appliance. It also shows the average utilization percentage of all the CPUs. The fact that this data can be fetched for a specific period of time makes it easier to monitor overactive CPU usage in CE.
Perform the following steps to interpret the data displayed in CPUs usage graph:
Step 1: In the Process CPU Usage widget, select the time period for which the data is required from the Time Period dropdown.
Note
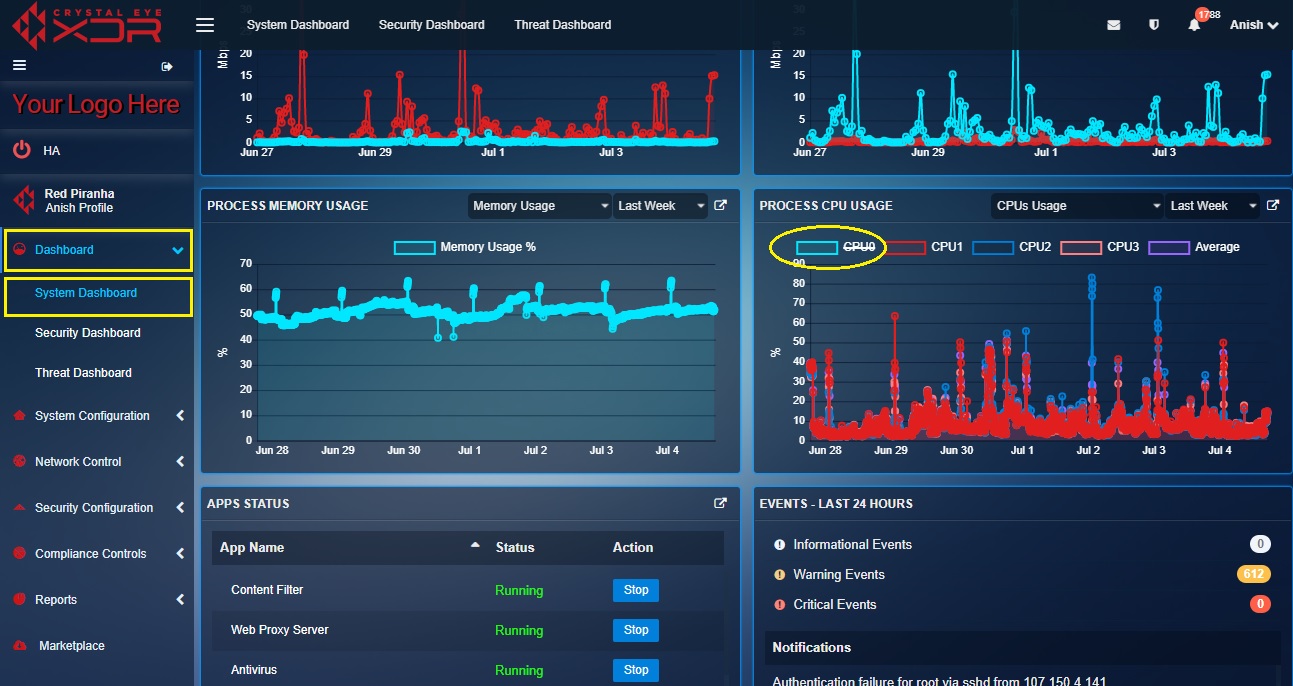
You will notice that the widget shows the CPU usage graph of all the CPUs and also shows the average CPU utilization graph. In order to enhance visibility of individual graphs, some of the graphs can be eliminated so that the one that has not been eliminated stands out. This has been done below in Step 2.
Step 2: Select the CPUs color icon in the top panel of the widget to eliminate the ones not required in the graph. In the screenshot below, we will eliminate CPU-0 related data.
Note
The x-axis shows the time period and the y-axis shows utilization percentage.
Step 3: Hover the cursor over the graph to view the utilization percentage of all the CPUs of the Crystal Eye XDR on-premise at a particular date and time.
What is Current Process CPU Usage? How to Interpret the Graphical Data Displayed in Current/Real Time CPU Usage Indicators?
The Current Process CPU Usage switch view provides real time data related to CPU utilization with respect to various procedural tasks performed/handled by the Crystal Eye XDR on-premise such as CE Dashboard, Log Reporting, IDS & IPS, Console Terminal etc.
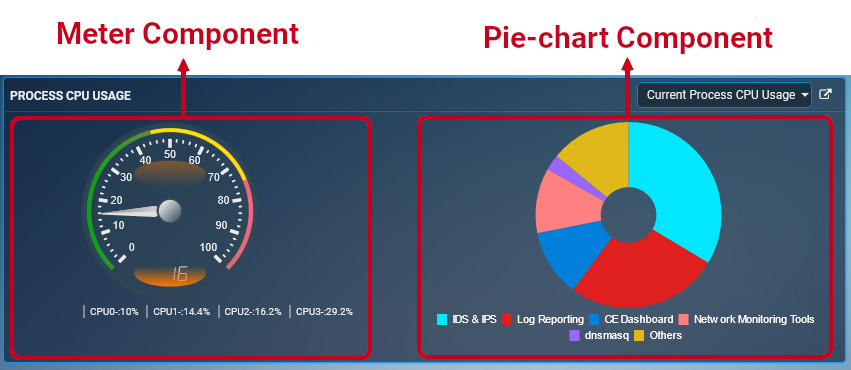
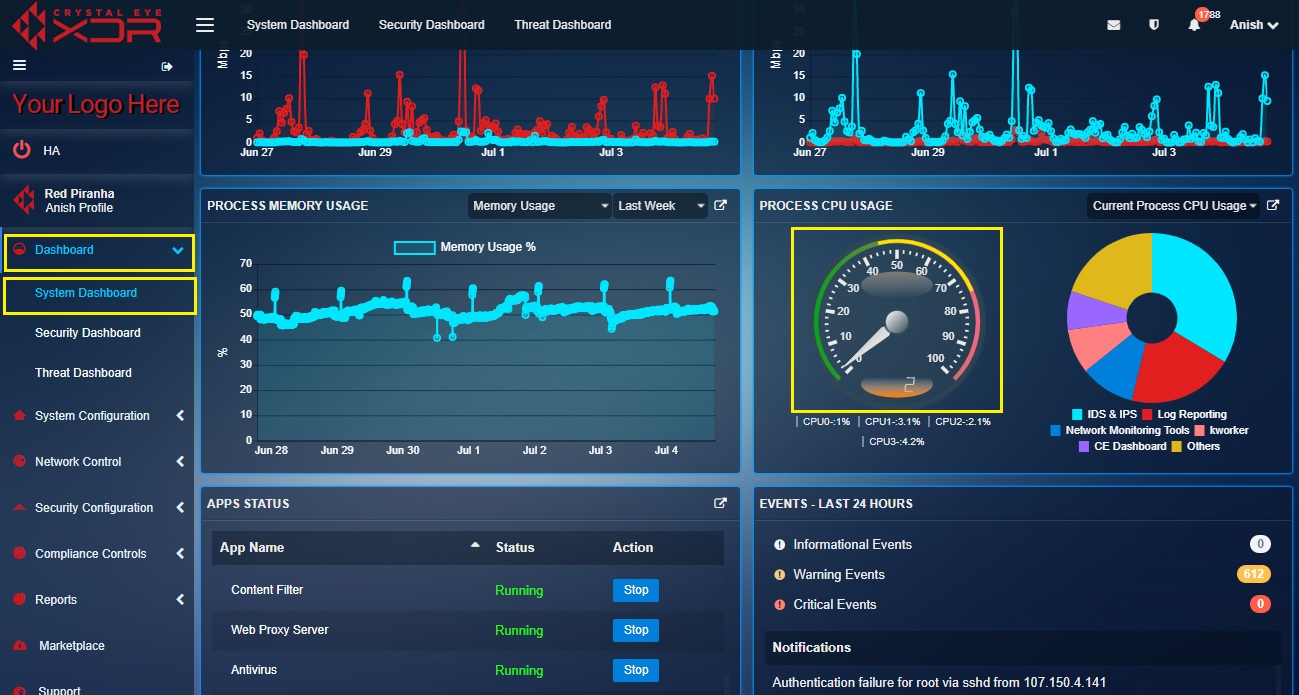
The graphic user interface of the Current Process CPU Usage is divided into two components (both the components have been highlighted in the screenshot below):
[A] Meter Component: The meter provides a real-time glimpse of the average CPU utilization whereas the current utilization percentage of each CPU is mentioned below the meter.
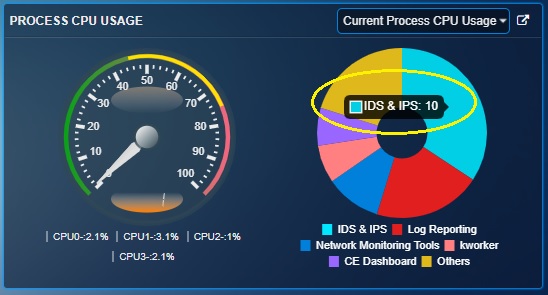
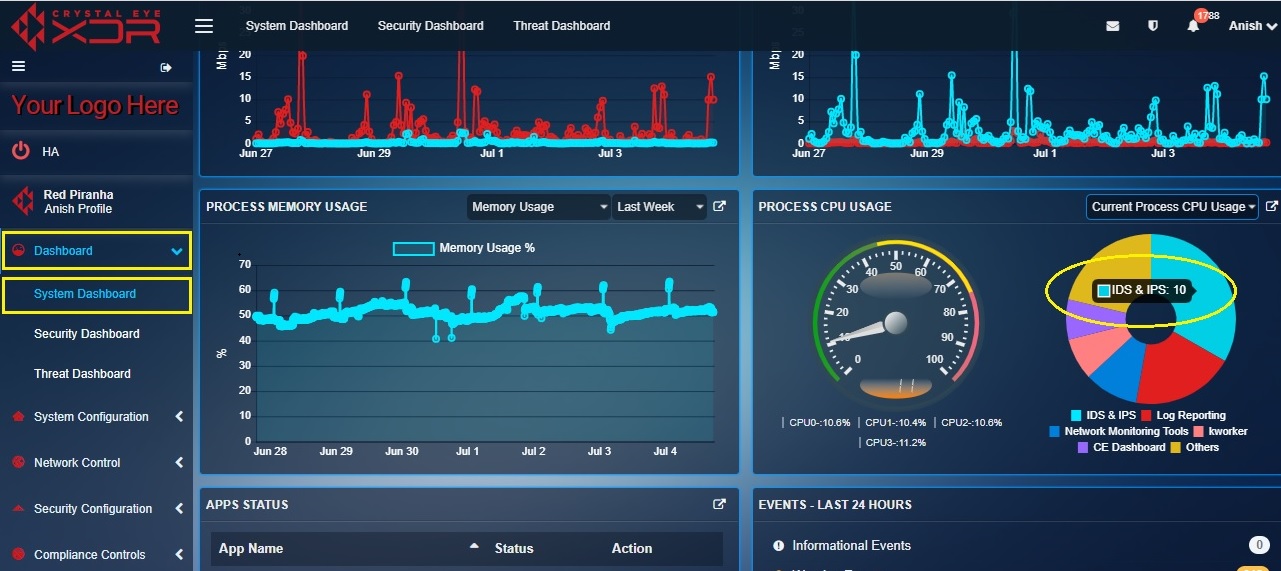
[B] Pie-Chart Component: The pie-chart shows the various procedural tasks handled by the Crystal Eye XDR on-premise such as CE Dashboard, Log Reporting, IDS & IPS, Console Terminal. Hover the cursor over the pie-chart to see the extent of CPU utilization for that particular task. For example, in screenshot below, on hovering the cursor over the green part of the pie-chart you will see a pop-up “IDS & IPS: 10%”. This means that the tasks related to IDS & IPS is taking up 10% of the CPU of the Crystal Eye XDR on-premise.
Perform the following steps to interpret the Graphical Data Displayed in Current/Real Time CPU Usage Indicators:
Step 1: In the Process CPU Usage widget, select Current Process CPU Usage from the dropdown.
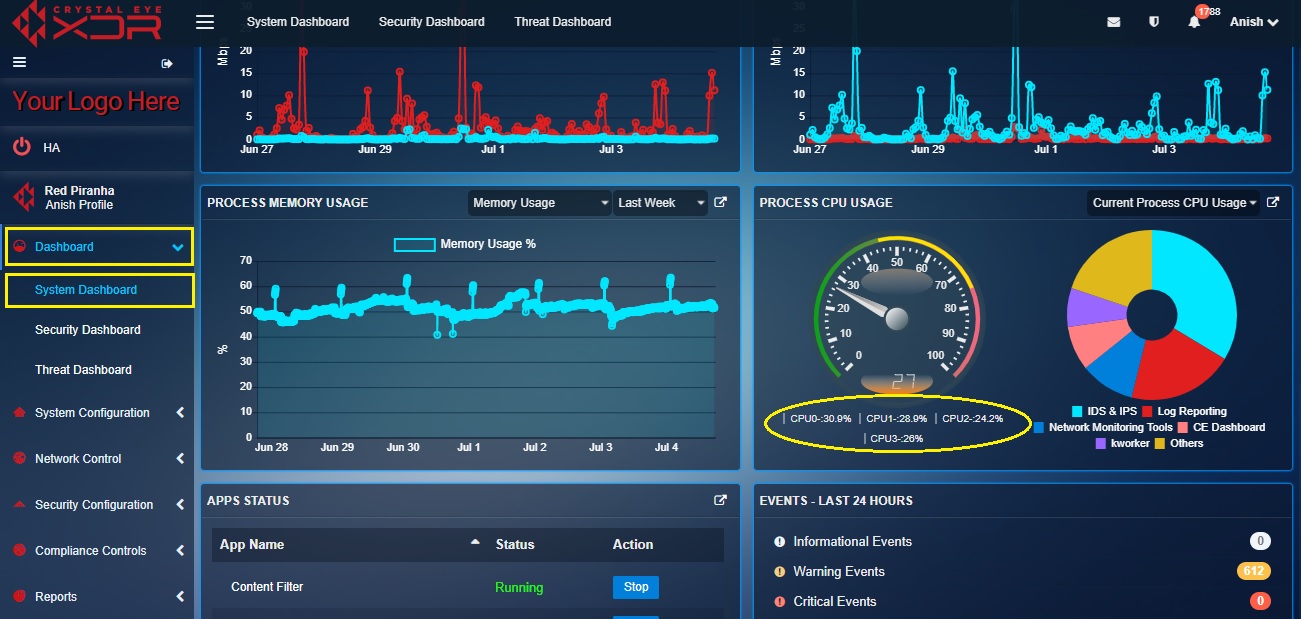
Step 2: You will now see the Current Process CPU Usage switch view. View the real-time CPU utilization percentage of each CPU of the CE appliance (highlighted in the screenshot below).
Step 3: View the average CPU utilization on the meter component.
Step 4: Hover the cursor over the pie-chart to see how much CPU is utilized for a particular task. For example, in the screenshot below on hovering the cursor over the red part of the pie-chart you will see a pop-up IDS & IPS: 10%. This means that the tasks related to IDS & IPS is taking up 10% of one of the CPUs of the Crystal Eye XDR on-premise.
How to View Detailed System Related Information of all Crystal Eye XDR CPUs?
As discussed above, the Process CPU Usage widget provides utilization percentage details of each CPU of the Crystal Eye XDR appliance with respect to various procedural tasks handled. However, the CE administrator can gain access to other system related information of the Crystal Eye XDR appliance through the System Report application. The System Report application (under the Reports section) can be accessed to refer to various system related information and file system summary. Click here to know more about System Report application.
Perform the following steps to view a detailed version of system related information of various CPUs of the Crystal Eye appliance:
Step 1: In the Process CPU Usage widget, click the link icon at the top-right corner.
Note
Once you perform the above step, you will be directed to the System Report application which is a part of the Reports category of the Crystal Eye. By viewing and analysing the designated tables in this application, the administrator can know the version of the CE, Kernel Version, System Time, CPU Model, Memory Size, Uptime, and Load. Apart from this, there are other useful information provided such as the total size of internal disk space, its used space, available space and percentage of the space used.

