AI and Escalation Reports
Overview
Crystal Eye XDRs AI and Escalation Reports displays Escalated IDPS Alerts, AV Alerts, Escalated AV Alerts and AI Alerts uplifting organisational threat monitoring and response capabilities.
Such optimized monitoring and response activities intended to find anomalies in the network through IDPS alerts, AV Alerts and AI Alerts reduces the risk of a breach and also ensures compliance with ISO 27002:2022 (Control 8.16 Monitoring Activities).
The human-machine teaming approach integrated into the CE XDR provides the capability to escalate anomalies detected in the IDPS alerts to Red Piranha’s Security Operations Team. Similarly, the AV Alerts also gets listed and can also be escalated and the list can then be reviewed under the Escalated AV Alerts section.
Note
All attack alerts can be escalated to Red Piranha’s Security Operations Team after the Incident Response Services application is installed. Escalations will not be processed until the Incident Response Services application is installed and configured. Click here to know how to configure the Incident Response Services application.
Navigation to AI and Escalation Reports
Go to Dashboard > Threat Hunt Dashboard > AI and Escalation Reports
AV Alerts
The Crystal Eye XDR appliance has an inbuilt Gateway Antivirus that examines and evaluates files as they transit in real time. The CE XDR makes use of a combination of signature and heuristic analysis to classify files to detect and automatically block malicious files to prevent infection from occurring.
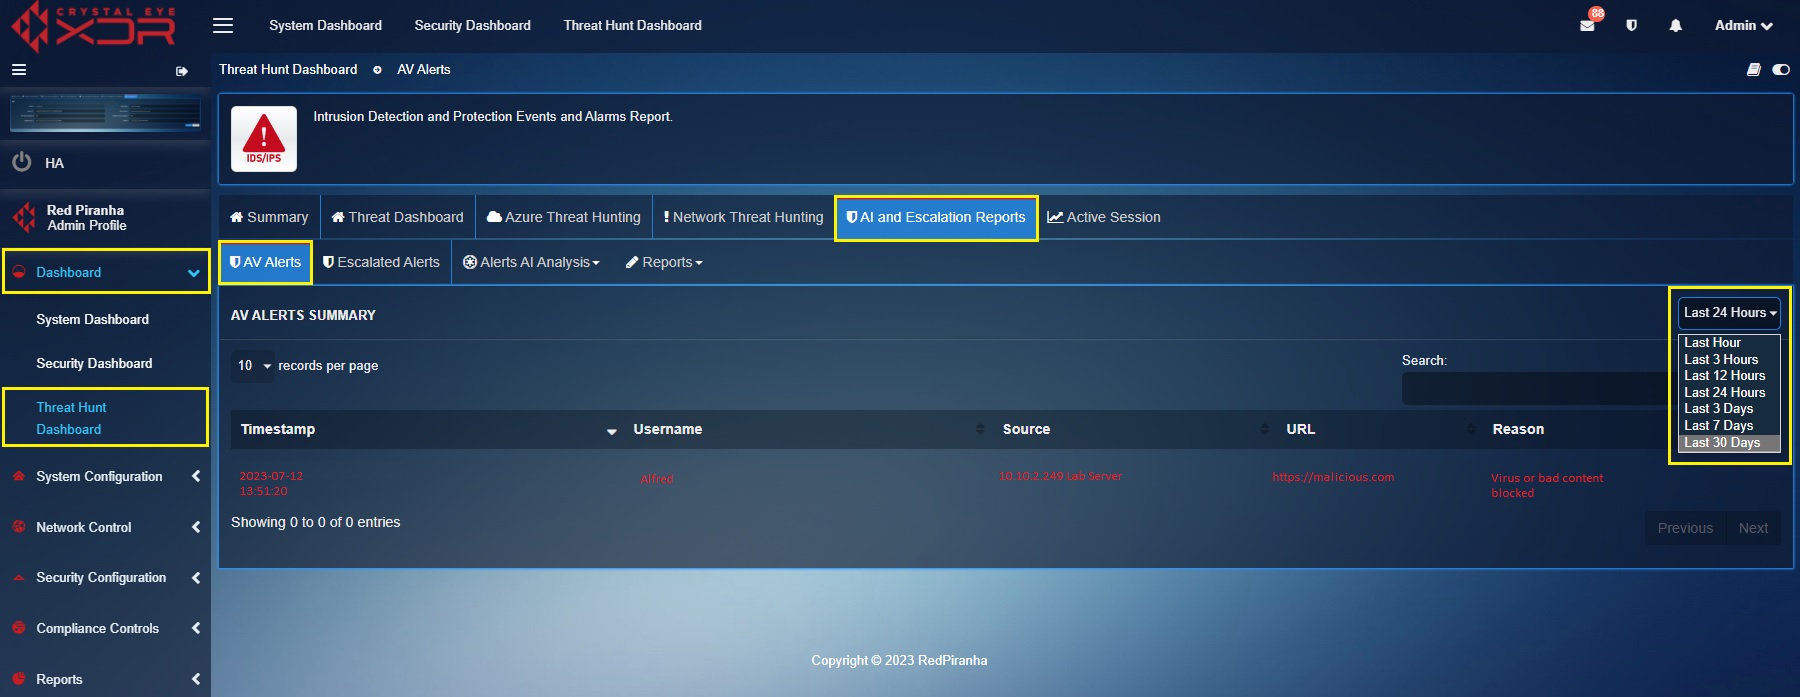
The AV Alerts Summary Report displays the AV scan summary specifying details regarding the malicious files that were blocked.
These details include Timestamp, IP Address (where the malicious files were detected), Site (domain name from where the malicious files originated), Blocked URL (URL of the blocked file), Reason (why the file was blocked), Content Type and Description (see screenshot below).
The AV Alerts Summary can be filtered using the time range dropdown. This feature can be used to analyse all the flagged bad content according to a particular time bucket (see screenshot below).
Note
The AV alerts can also be viewed under the scan summary section of the Security Dashboard. Know more here
Escalated Alerts
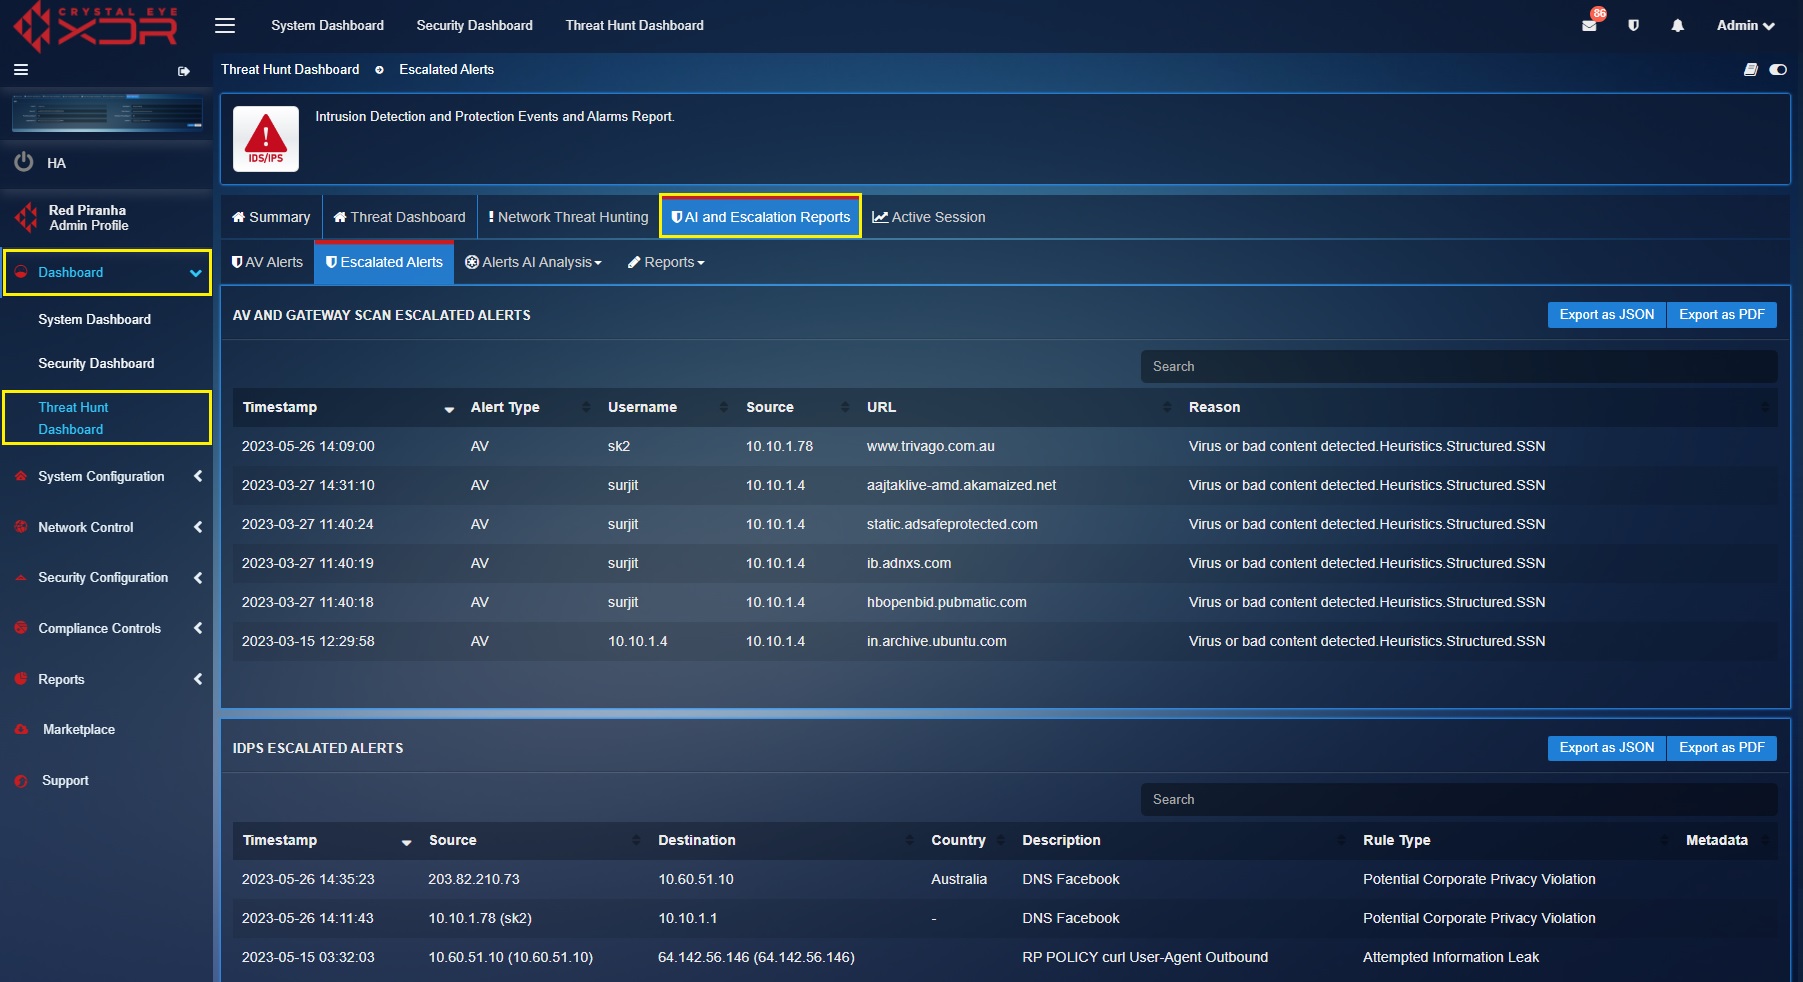
The Escalated Alerts section displays all AV & Gateway Scan Escalated Alerts and IDPS Escalated Alerts. The Crystal Eye XDRs response capabilities is integrated with its Managed Detection & Response licensing which enables administrators to escalate alerts to the global Security Operations Centre (SOC) of Red Piranha for further analysis, investigation, and response.
All escalated AV & IDPS Alerts are listed under this section making it convenient for the CE XDR administrator to keep a track of the escalations. A consolidated escalations report can be downloaded in PDF and JSON format.
AV & Gateway Scan Escalated Alerts
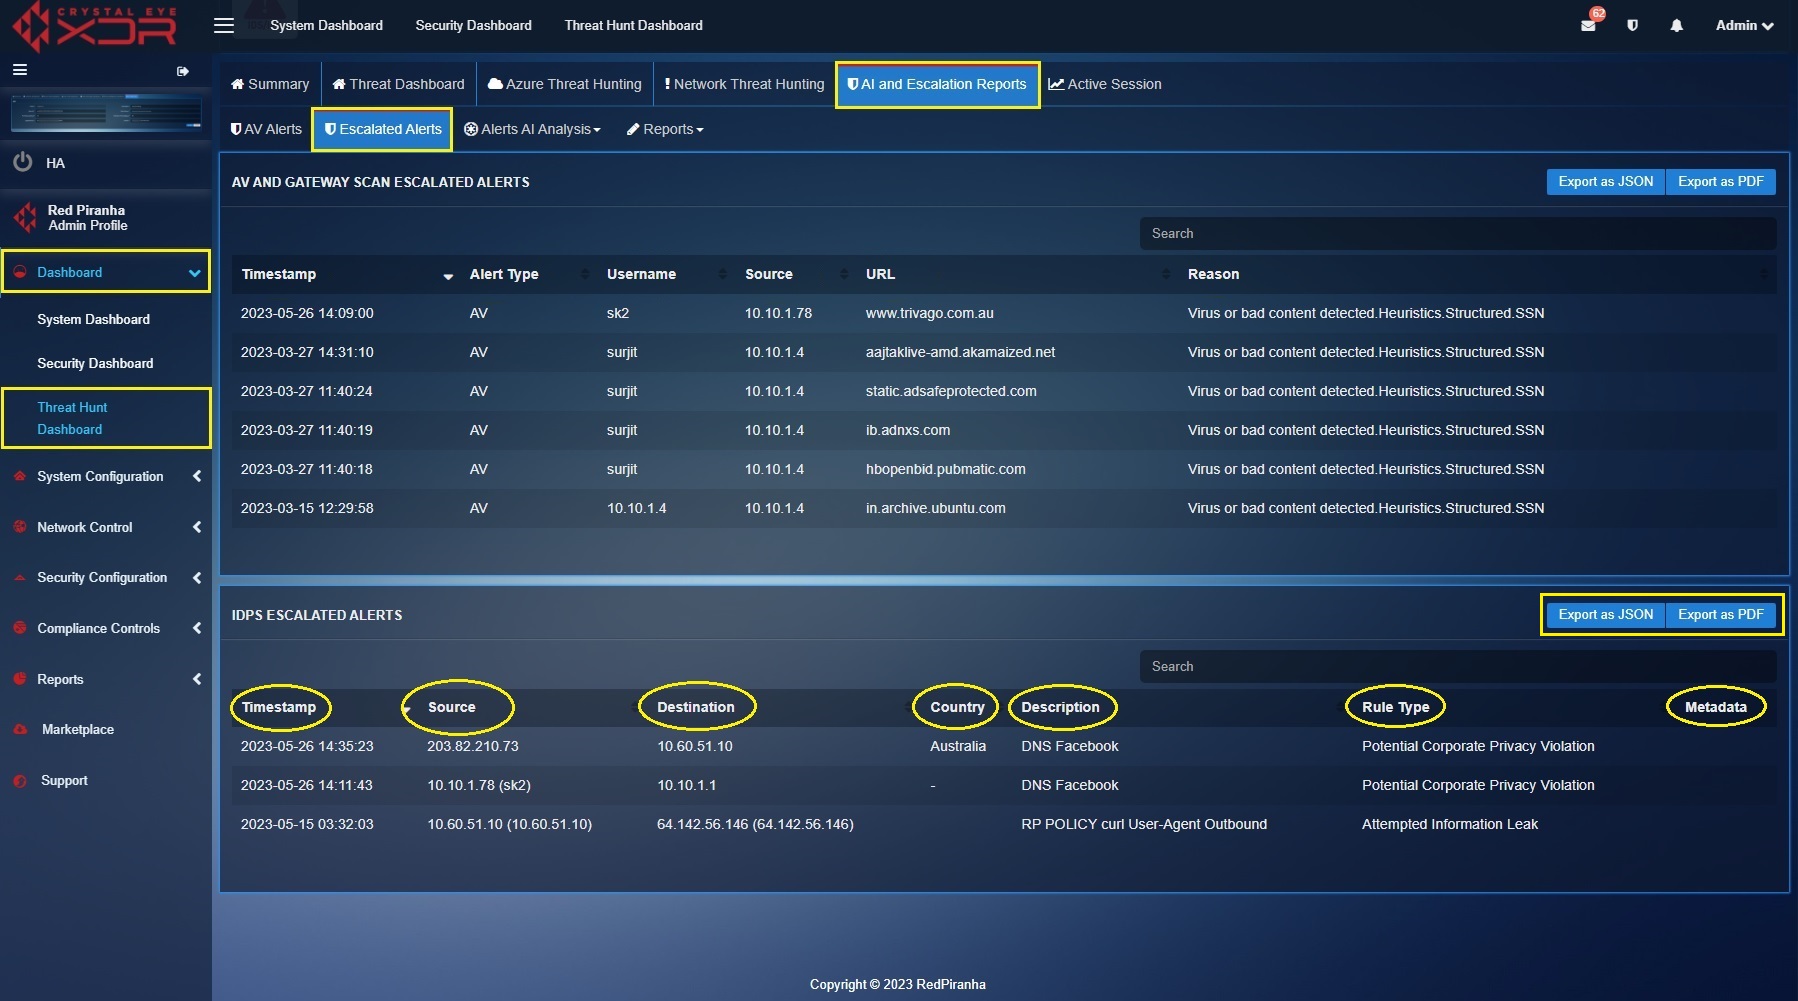
Each escalated AV & Gateway Scan alert displayed here has a Timestamp, Alert Type, Username (user assigned to the affected device), Source (IP address of the affected device), URL (malicious URL accessed by the user), and the Reason column (reflecting the information of the virus detected). Detailed report can be exported both in PDF and JSON format.
A PDF format report of the escalated AV & Gateway Scan alerts can be exported in JSON and PDF format. Click the highlighted buttons as shown in the screenshot above.
The PDF format of the Escalated AV Alerts Report sheds light on various components of the AV alerts such as Timestamp, IP address of the end client where the malware was detected, the URL from where the malware infection originated and the description of the quarantined malware (screenshot below). 
IDPS Escalated Alerts
Each escalated IDPS alert displayed here has a Timestamp, Source IP, Destination IP, Country of Origin, description of the triggered IDPS alert and the Rule Type that triggered the IDPS alert (screenshot below). Detailed report can be exported both in PDF and JSON format. Learn how to escalate IDPS alerts to Red Piranha’s Security Operation’s Team here.
A PDF format report of the Escalated IDPS Alerts can be exported in JSON and PDF format. Click the highlighted buttons as shown in the screenshot above.
The PDF format of the Escalated IDPS Alerts Report sheds light on four major components of the alerts such as the Timestamp, Source IP, Destination IP and the Description (of the alert). Refer the following screenshot to view the report in pdf format. 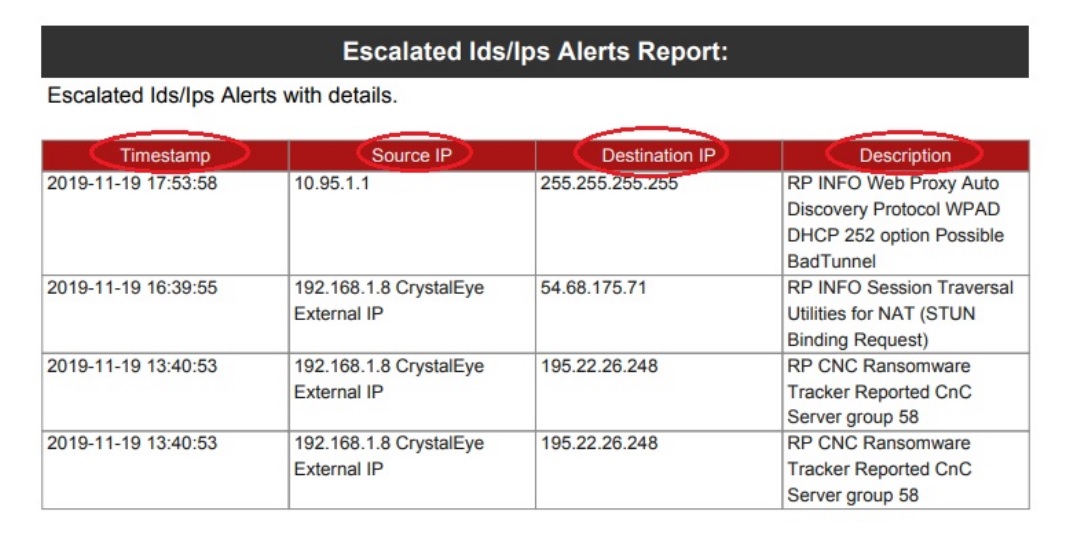
Alerts AI Analysis
Crystal Eye XDRs machine learning features are aimed at detecting anomalies often found and associated with attackers undertaking lateral movement during pivoting.
The alert AI analysis of the CE XDR is based on the Human-in-the-Loop (HITL) model which allows humans to give direct feedback to the Alert AI analysis module to improve its overall capability to detect anomalies.
The aim here is to find anomalies in traffic patterns that rule based signatures might miss, making it easier for SOC and threat hunt teams to detect advanced persistent threats and zero-day attacks.
AI analysis needs sufficient data to build initial baseline for anomaly detection. It generally takes minimum 7 days. Once the system has created a baseline, a user should then train the ML detection engine and the system to increase its accuracy for anomaly detection.
AI Analysis for SID Anomaly Alerts
Signature Identity (SID) is a unique identification number auto assigned to an IDPS Policy rule. These rules are conceptualised and created by the security operations team of Red Piranha to provide context to the Intrusion Detection & Protection (IDPS) mechanism of the Crystal Eye XDR.
One of the most important functions of the IDPS signature rules is to specify the component of the network traffic that the system must inspect to detect attacks. An IDPS action is triggered if a rule is matched with specific pre-defined attack patterns. The IDPS system performs the assigned action which helps in protecting the Crystal Eye network.
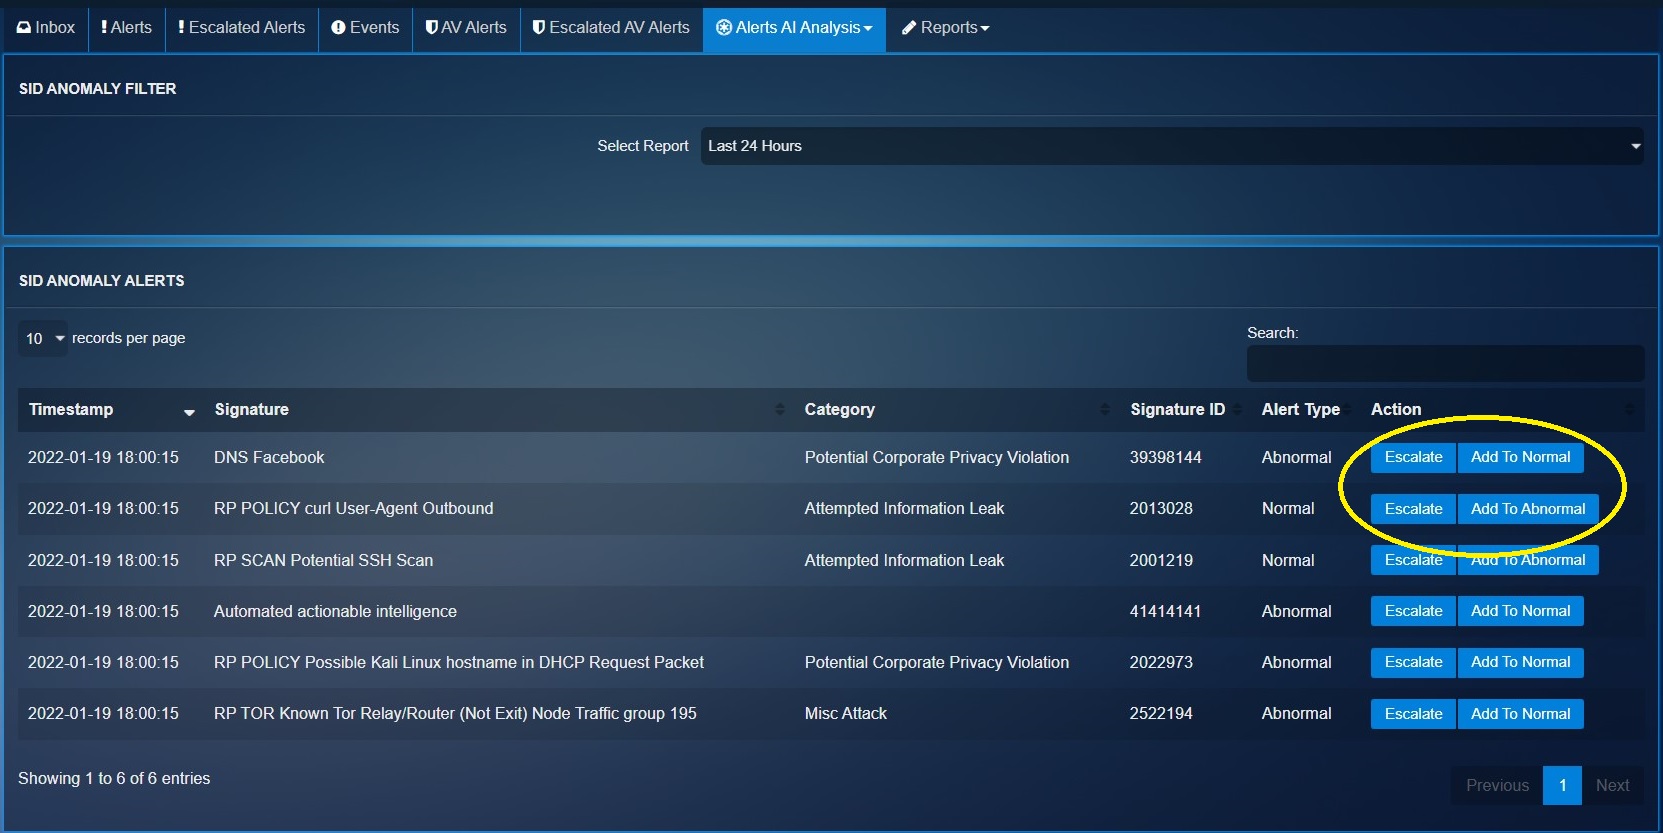
The Alert AI Analysis module of the Crystal Eye XDR is designed to identify SID anomaly alerts and display it in the SID anomaly alerts section tagged with a Alert Type (Abnormal or Normal).
The machine learning module works such that the CE XDR administrator can be the human-in-the-loop component providing quality inputs to train the system to reduce IDPS policy rules related false positives. This can be done by adding the SIDs to the normal or abnormal behaviour bucket. A SID anomaly can also be escalated to the Red Piranha Secops team from this section.
Note
Escalations will not be processed until the Incident Response Services application is installed and configured. Click here to know how to configure Incident Response Services application.
The screenshot below shows the list of possible SID anomaly alerts, the Escalate button, Add to Normal Bucket button, and Add to Abnormal Bucket button.
AI Analysis for SSH Protocol Alerts
A given network might have legitimate set of SSH users (mostly system administrators). These internal users would mostly use SSH protocol to establish secure command-line sessions with network devices such as firewall, routers, and switches.
The machine learning module of the CE XDR can be trained to detect malicious SSH attempts in the network by manually labelling the SSH related anomaly. The manual intervention to train the ML module of the CE XDR ensures that it is the recipient of high-quality data. The machine learning algorithm learns to make decisions from this data ensuring that it flags an anomaly such as a sudden spike in SSH requests originating from an internal IP address.
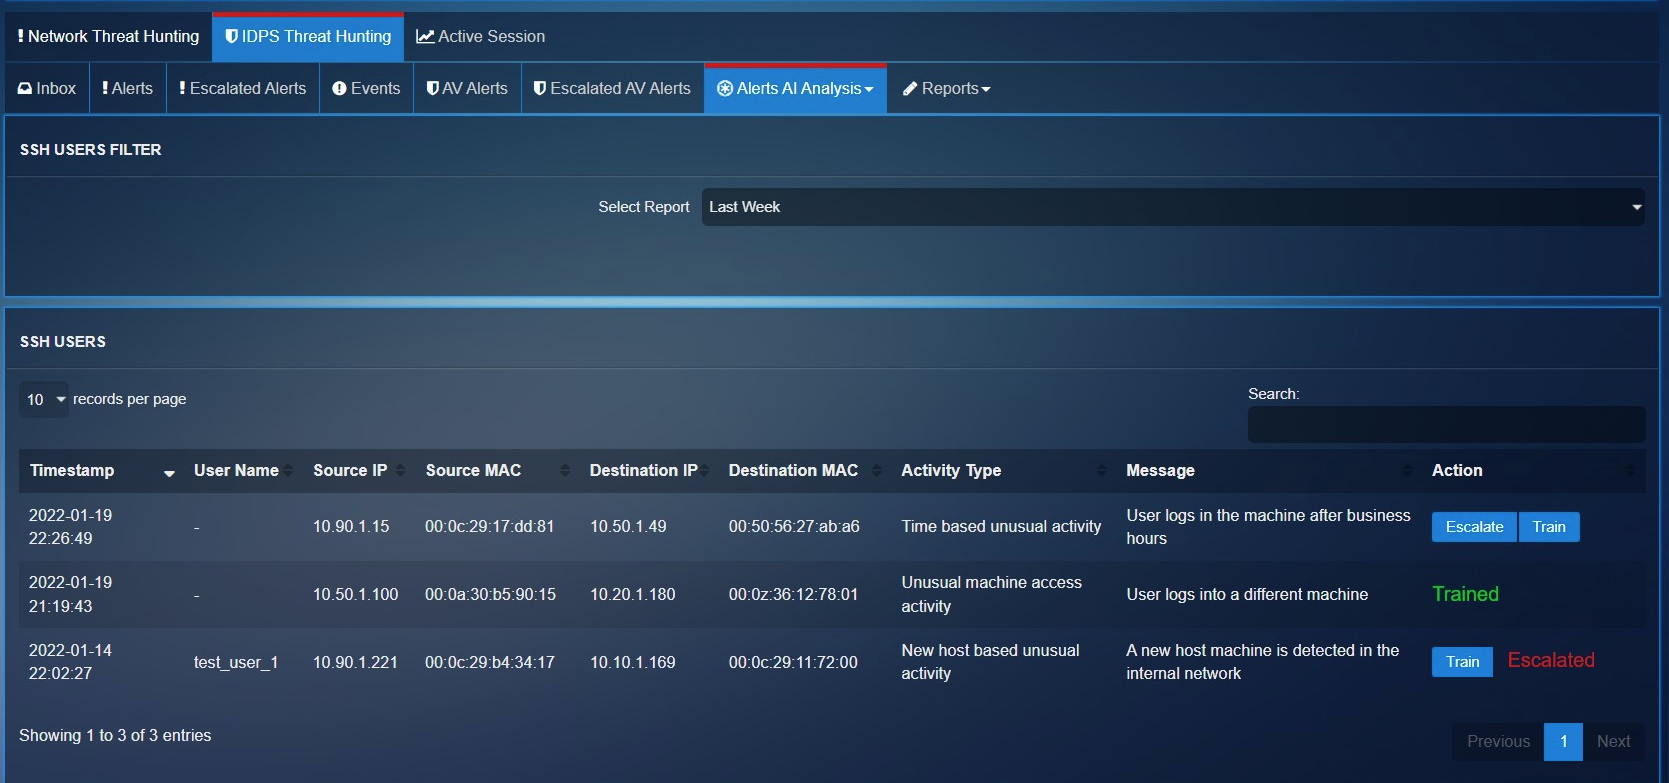
The system creates baselines of traffic flow based around network traffic that is key in the attacker gaining persistence and a foothold in a network. Such user behaviour flagged as abnormal and labelled as an anomaly will be displayed in the SSH Users section. The Train button below can be used to train the ML module of the CE XDR. The Escalate button can be used to share vital SSH users related anomalies with the security operations team of Red Piranha (See screenshot below).
Note
You may view the Alert AI Analysis for SSH Protocol by selecting SSH from the Alerts AI Analysis dropdown.
Scheduling AI Reports Via Email
AI Alert Reports can be scheduled and sent to a designated email address. These periodic reports help in maintaining a cyclic monitoring process of analysing AI alerts avoiding incidents that might disrupt the smooth functioning of the business.
Pursue the following steps to schedule an AI Alert report and get it delivered on a designated email address.
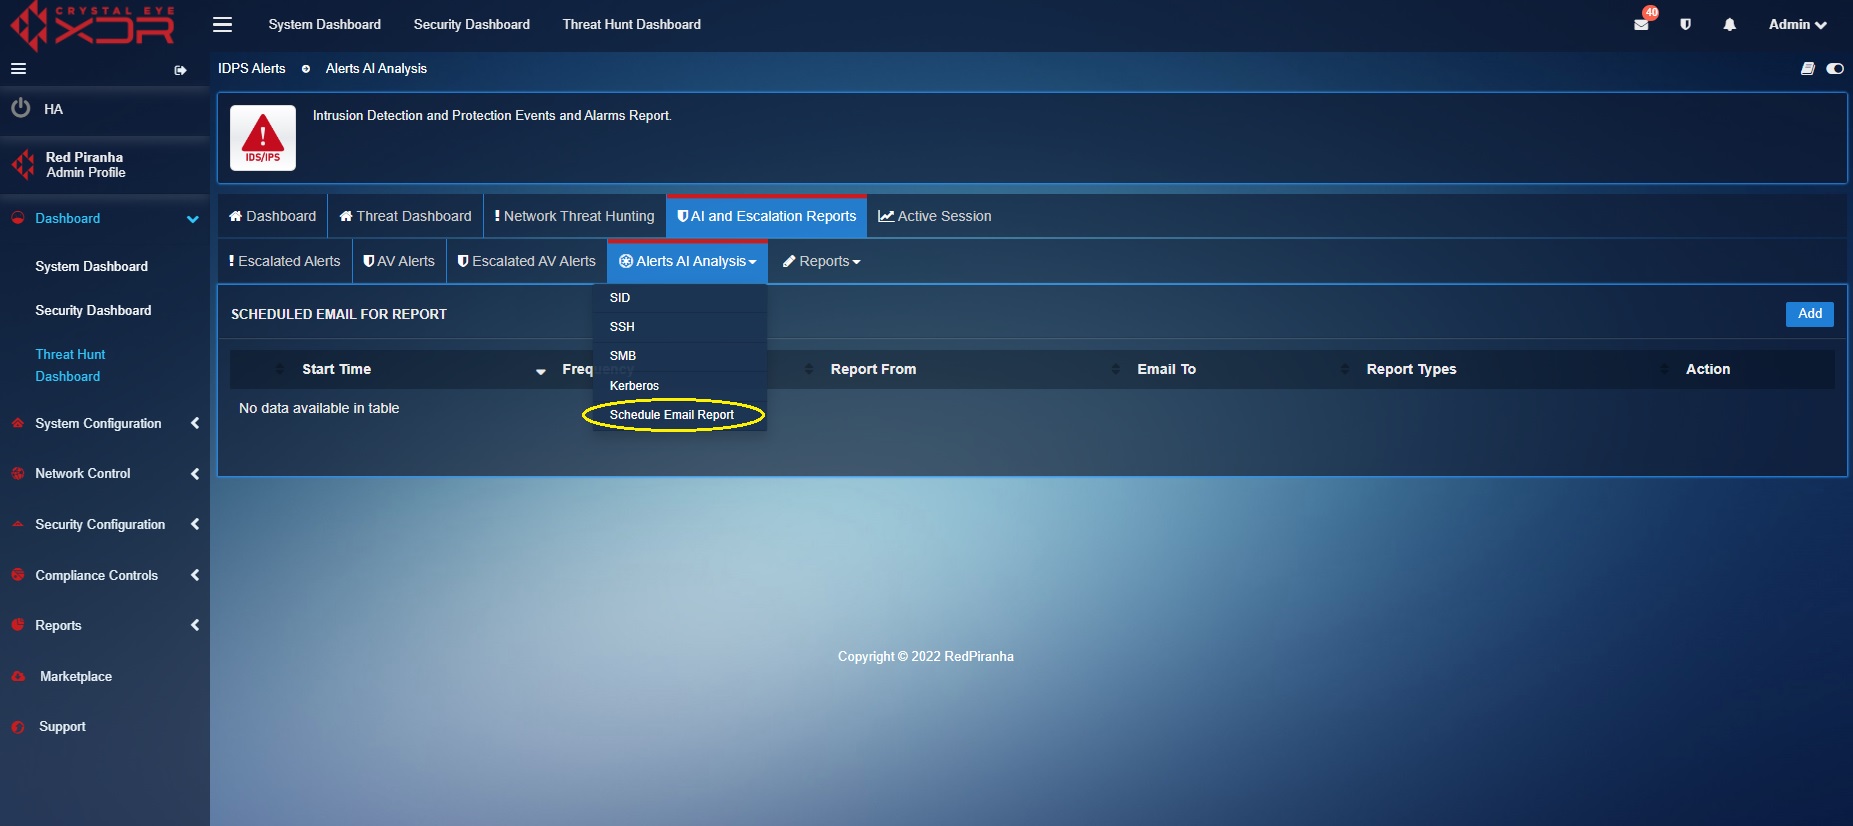
Step 1: Go to Threat Hunt Dashboard > AI and Escalation Reports and click the Alerts AI Analysis dropdown button
Step 2: Select Schedule Email Reports from the Alerts AI Analysis dropdown.
Step 3: You will now see the scheduler. Click the Add button on the top-right corner of the Scheduled Email for Report section.
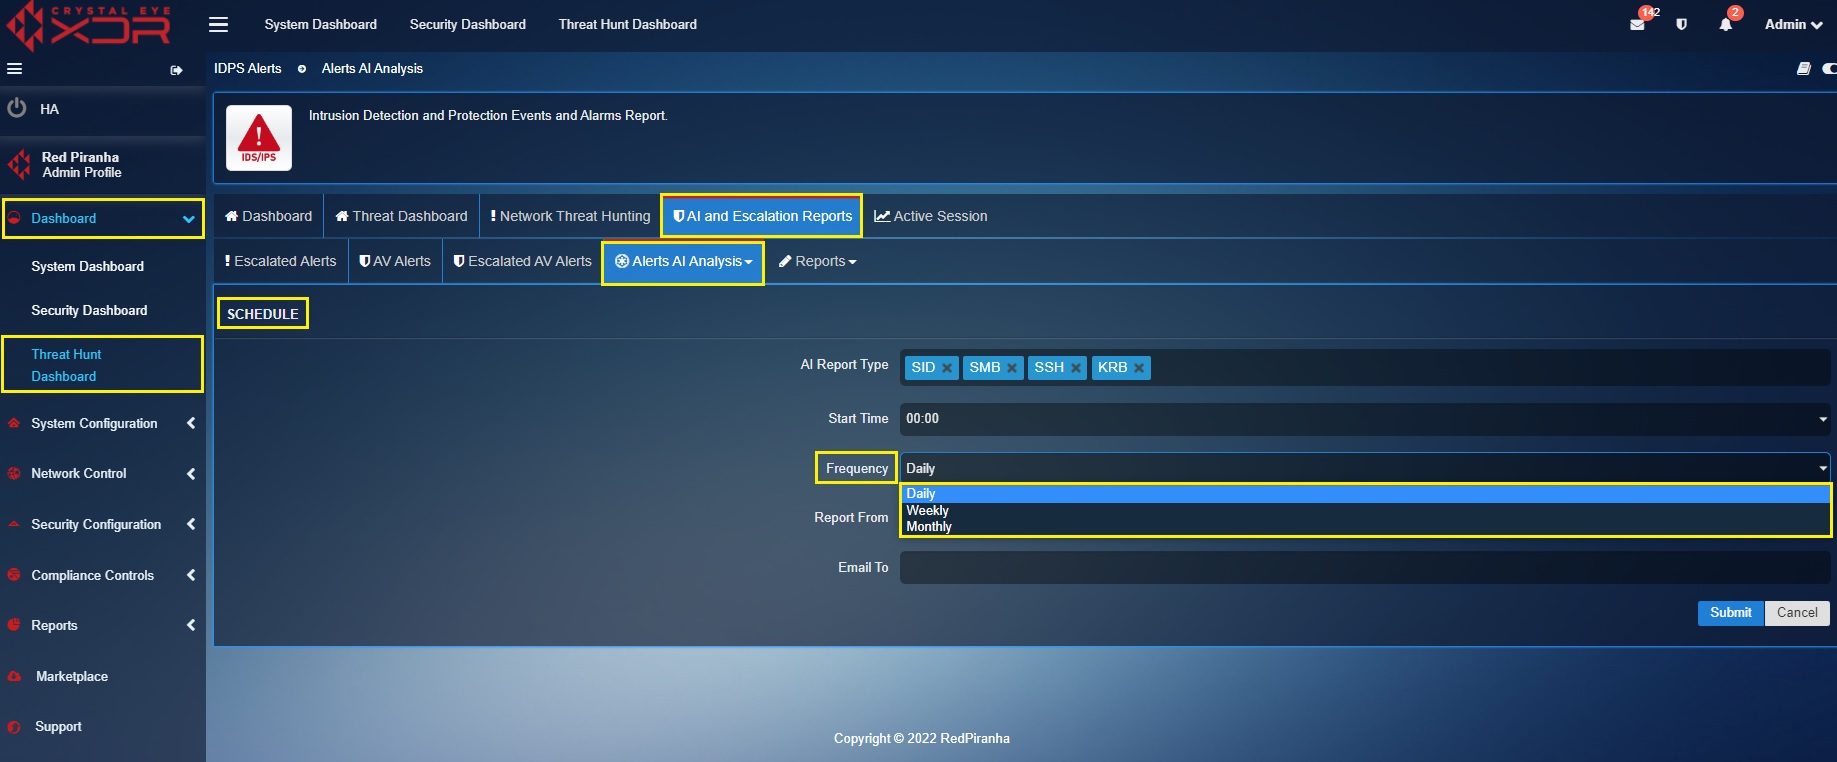
Step 4: You will see AI Report Type (such as SID, SSH, SMB and KRB) listed in the dropdown. Select the required AI Report Type.
Step 5: Specify the time at which you want the report to be triggered and sent to your email address.
Step 6: Select the frequency at which the report is to be sent to the email address of your choice.
Note
The frequency of the reports can be set to Daily, Weekly or Monthly.
Step 7: Enter the email address in the textbox where you want to receive the AI Alerts Reports and click the Add button.
Scheduling IDPS Events Summary Report Via Emails
The Crystal Eye XDR can be configured to schedule IDPS Events Summary Reports via emails. The report consists of event types such as Alerts, DNS, Flow and SSH.
How to schedule an IDPS Events Summary Report via Emails?
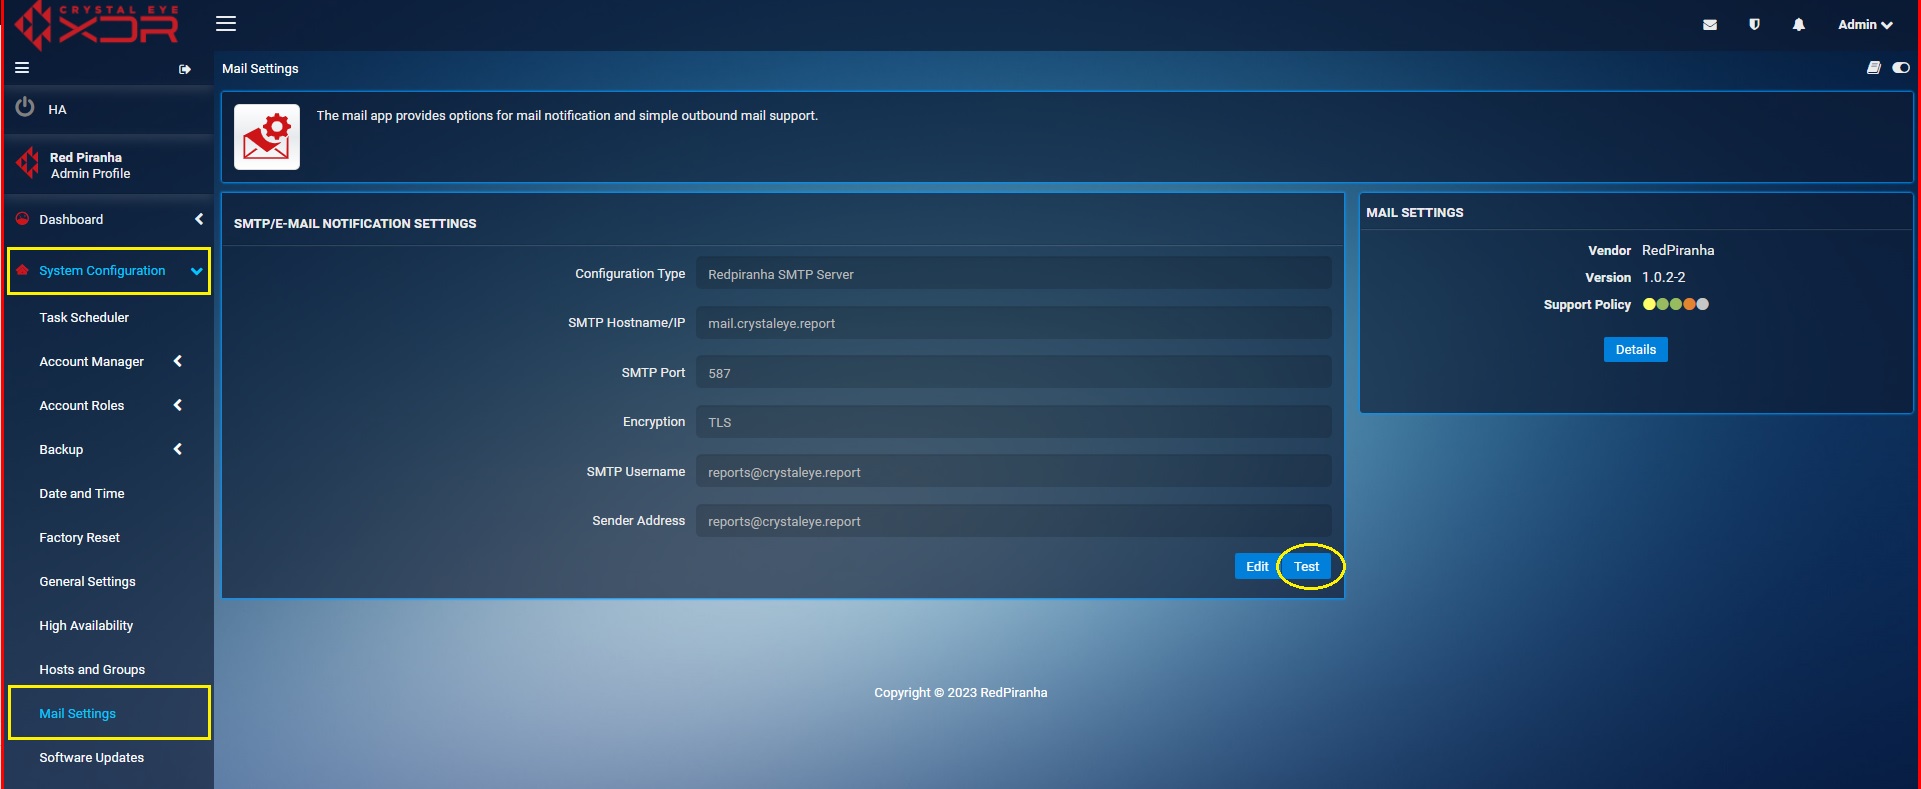
Checklist before scheduling IDPS Reports: Go to System Configuration > Mail Settings, you will see SMTP/E-MAIL notification settings. Use the Test Feature to check whether the mail settings are as per your email domain settings. In order to do so, click the TEST Button as mentioned in the screenshot below.
You will now see the Notification Test page. Enter you email address and click Send Now button. The system will now let you know whether the email address matches your domain configuration. If not, please configure your domain settings in SMTP/E-MAIL notification settings page.
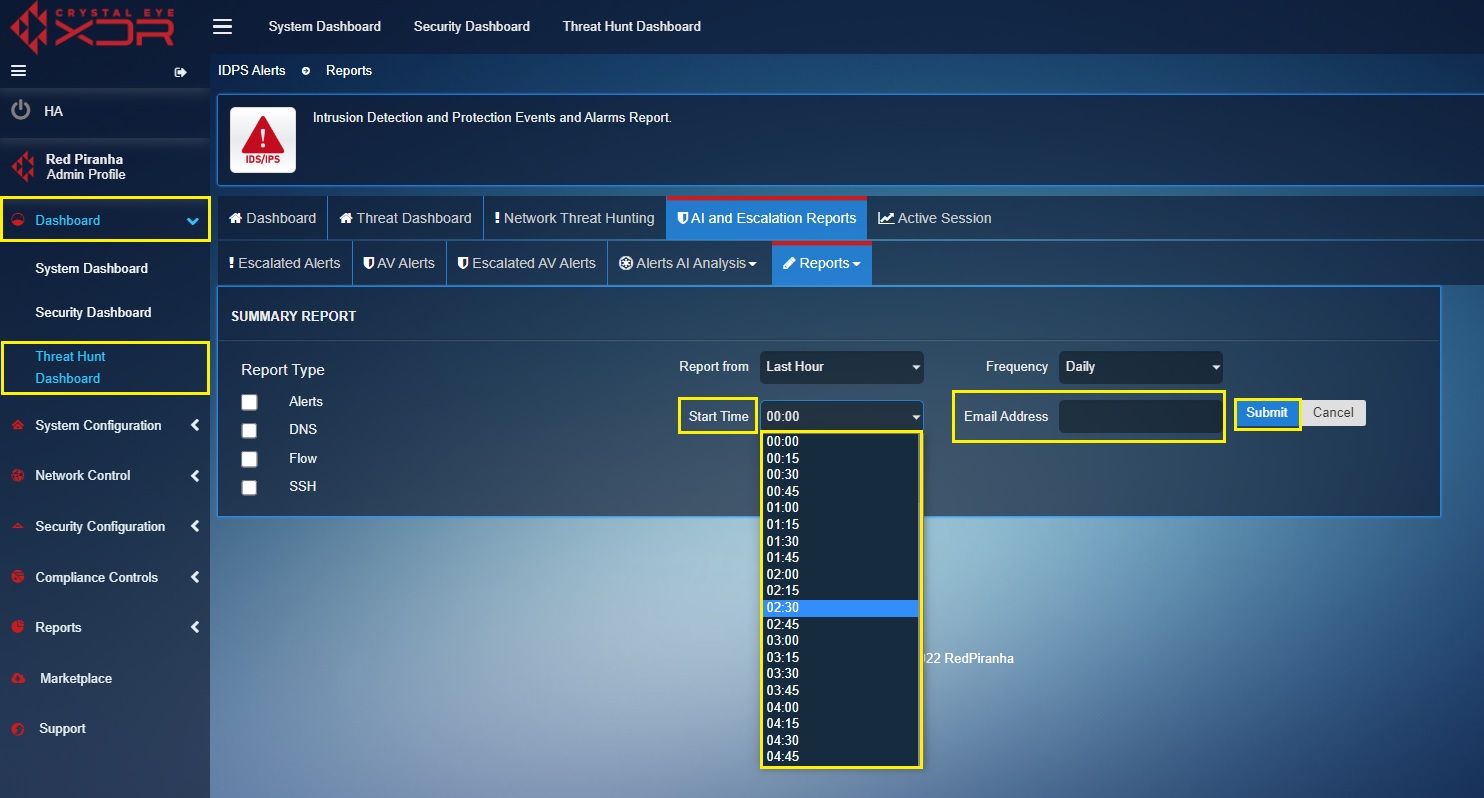
Step 1: Go to Threat Hunt Dashboard > AI and Escalation Reports > Reports > Summary Report
Step 2: Click the Add button on the top-right corner of the Summary Report section.
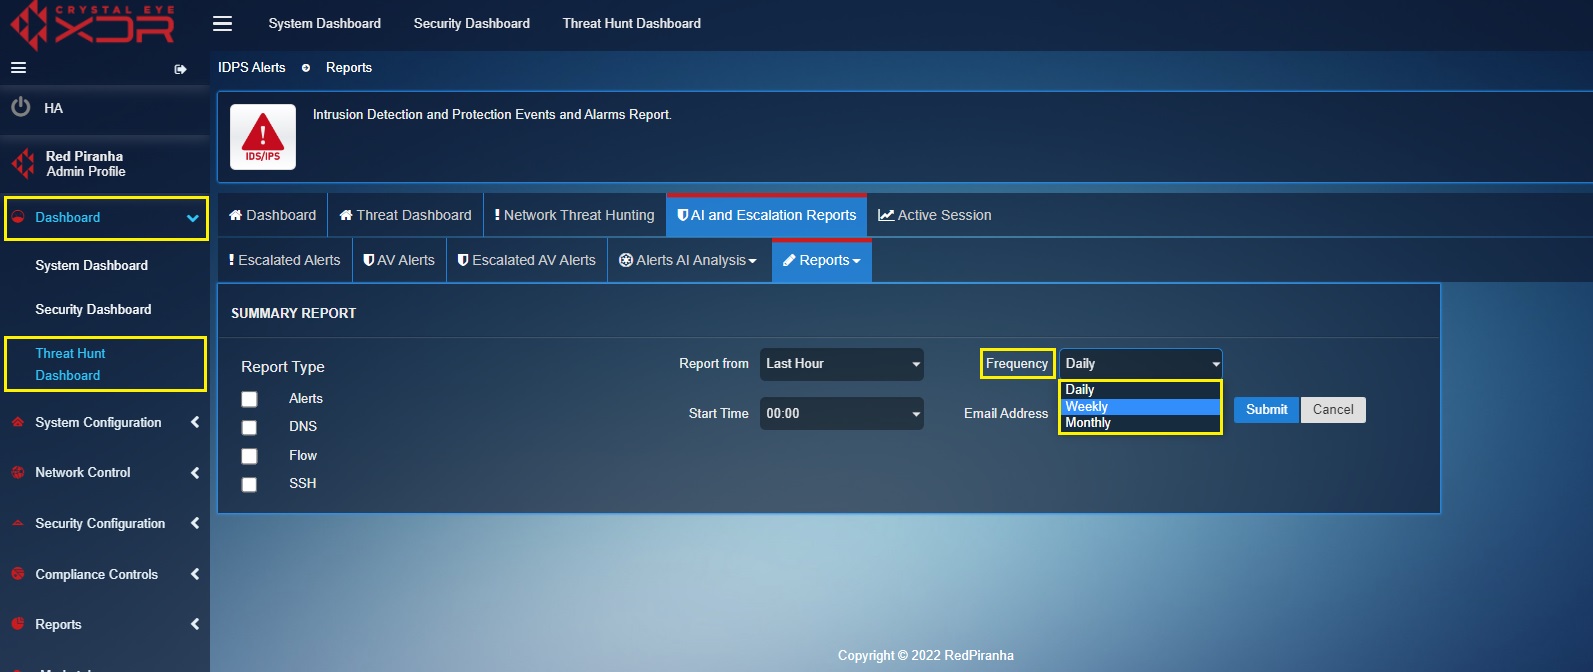
Step 3: You will now see the summary report scheduler. Select the IDPS Events Report Type as per requirements.

Step 4: Select the frequency of the report to be sent via email from the Frequency Dropdown.
Note
The frequency of the reports can be set to Daily, Weekly or Monthly.
Step 5: Select the time at which the report is to be sent to the designated email address, enter the email address in the textbox and click the Submit button.
Below is the explanation of the components of the downloaded IDPS Reports:
Alerts
- Top Alert Signature: It shows the top alert signature that has been detected by the Crystal Eye XDR for the time period selected while downloading the report. This monitoring metric also consists of the total counts of the top alerting signature.
-
Top Alert Category: It shows the top alert category of the signature that has been detected by the Crystal Eye XDR for the time period selected while downloading the report. This monitoring metric also consists of the total count of the top alert category of the signature.

-
Top Alerting Source IPs: It shows the top alerting source IPs that has been detected by the Crystal Eye XDR for the time period selected while downloading the report. This monitoring metric also consists of the total count of the top alerting source IPs.

-
Top Alerting Destination IPs: It shows the top alerting destination IPs that has been detected by the Crystal Eye XDR for the time period selected while downloading the report. This monitoring metric also consists of the total count of the top alerting destination IPs.

-
Top Alerting Source Ports: It shows the top alerting source ports that has been detected by the Crystal Eye XDR for the time period selected while downloading the report. This monitoring metric also consists of the total count of the top alerting source ports.

-
Top Alerting Destination Ports: It shows the top alerting destination ports that has been detected by the Crystal Eye XDR for the time period selected while downloading the report. This monitoring metric also consists of the total count of the top alerting destination ports.

Reports
-
Top Request RRNames: It shows the top request RRNames that has been detected by the Crystal Eye XDR for the time period selected while downloading the report. This monitoring metric also consists of the total count of the top request RRNames.

-
Top DNS Servers: It shows the top DNS Servers that has been detected by the Crystal Eye XDR for the time period selected while downloading the report. This monitoring metric also consists of the total count of the top DNS Servers.

-
Top DNS Clients: It shows the top DNS Clients that has been detected by the Crystal Eye XDR for the time period selected while downloading the report. This monitoring metric also consists of the total count of the top DNS Clients.

-
Top Request Types: It shows the top Request types that has been detected by the Crystal Eye XDR for the time period selected while downloading the report. This monitoring metric also consists of the total count of the top Request Types.

-
Top Response Codes: It shows the top Response codes that has been detected by the Crystal Eye XDR for the time period selected while downloading the report. This monitoring metric also consists of the total count of the top Response Codes.

SSH
-
SSH Client Software: It shows the SSH Client Software name and version that has been detected by the Crystal Eye XDR for the time period selected while downloading the report. This monitoring metric also consists of the total count of the SSH Client Software detected by Crystal Eye XDR.

-
SSH Server Software: It shows the SSH Server Software name and version that has been detected by the Crystal Eye XDR for the time period selected while downloading the report. This monitoring metric also consists of the total count of the SSH Server Software detected by Crystal Eye XDR.

-
Top SSH Client Hosts: It shows the SSH Client Hosts address that has been detected by the Crystal Eye XDR for the time period selected while downloading the report. This monitoring metric also consists of the total count of the SSH Client hosts.

-
Top SSH Server Hosts: It shows the SSH Server Hosts address that has been detected by the Crystal Eye XDR for the time period selected while downloading the report. This monitoring metric also consists of the total count of the SSH Server hosts.


