Network Interface Reports
Overview
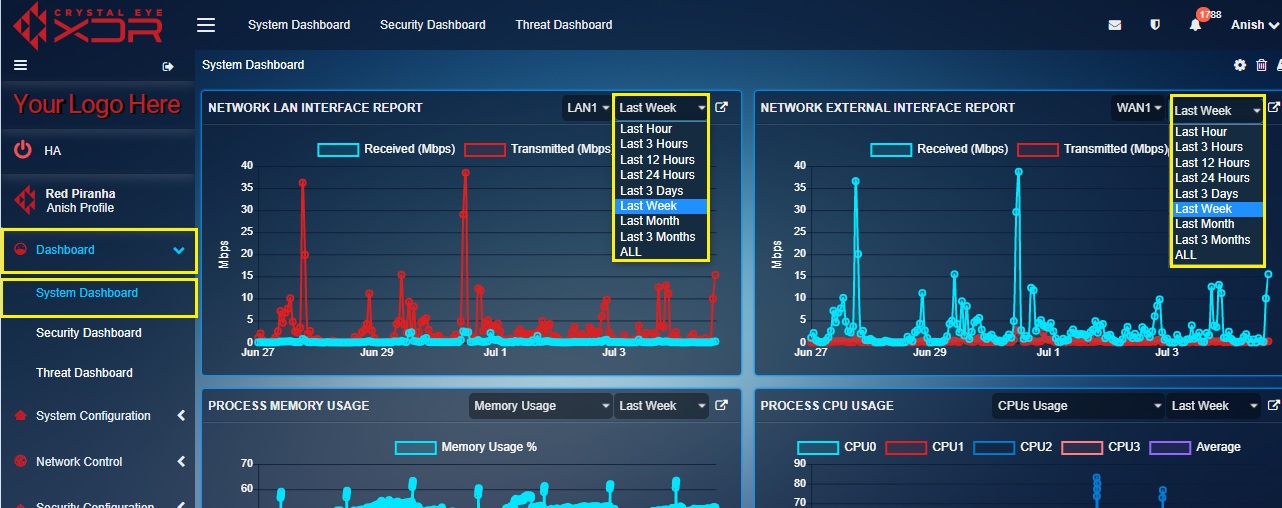
The Network Interface Report gives users insights of the data received and transmitted in LAN, WAN, VLAN, Virtual and Wifi interfaces of the Crystal Eye XDR network. These graphical reports are displayed in a widget format in the System Dashboard. Users can select the desired reporting period ranging from the last hour to the last 3 months to fetch data pertaining to a particular time period. These reports provide graphical information of the amount of data received and transmitted across all LAN, WAN, VLAN, Virtual, and Wifi interfaces at a given period of time in two different widgets.
The Screenshot Below Shows the Network Interface Report Graph:
Note
In the above highlighted graphical representation of the network interface report, y-axis shows the amount of data transmitted and received in Mbps and x-axis shows the time period.
How to Interpret the Graph Data in the Network Interface Reports Widget?
Step 1: In the LAN & WAN interface report widget, select the time window for which the historical data is required from the Time Period dropdown.
Note
By default, the system shows the data transmitted and received over WAN and LAN from the past week. However, you can view data of other interfaces by selecting them in the dropdown shown below.
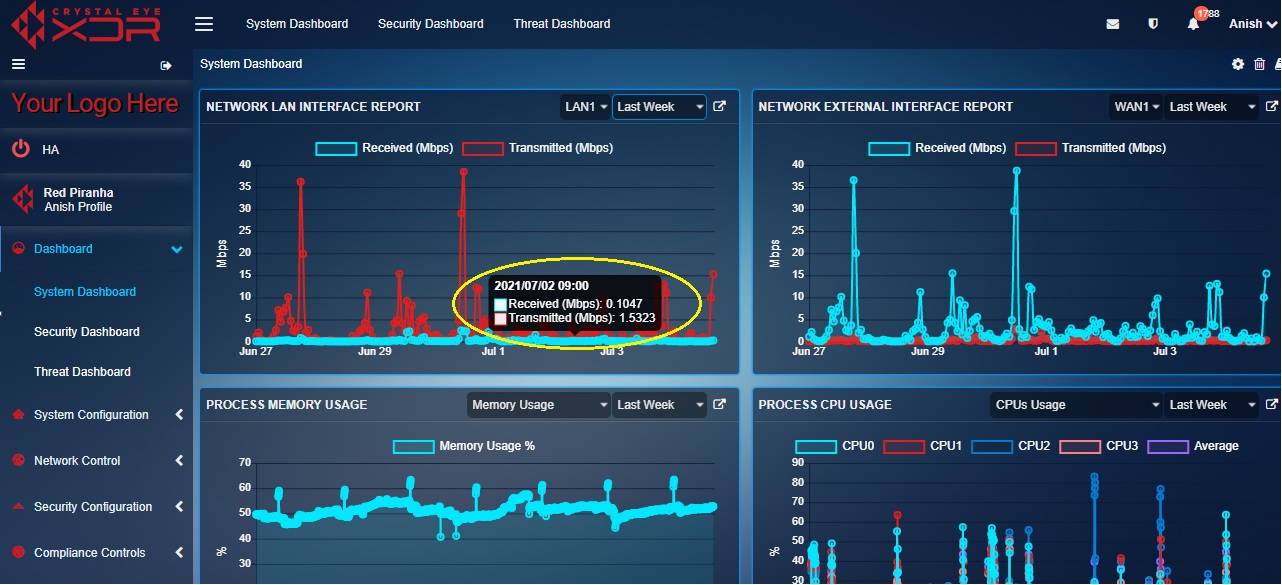
Step 2: Hover your cursor over the dots on the green and the red curve of the graph to know the amount of data received and transmitted (in Mbps) at a given point of time.
Note
In the above screenshot the green curve shows the data received (in Mbps) and the red curve shows the data transmitted (in Mbps). The details in the pop-up include Date, Time, Received (Mbps) and Transmitted (Mbps). The amount of received and transmitted data pertaining to LAN, WAN, VLAN, Virtual and Wifi interface is captured on an hourly basis.
How to Segregate the Graph Data in the Network Interface Reports Widget?
The network interface reports graph shows information related to both data received and transmitted over a given period of time. However, CE administrators can segregate data so as to display individual graph curves either showing data received or data transmitted. Perform the following steps to segregate the graph data.
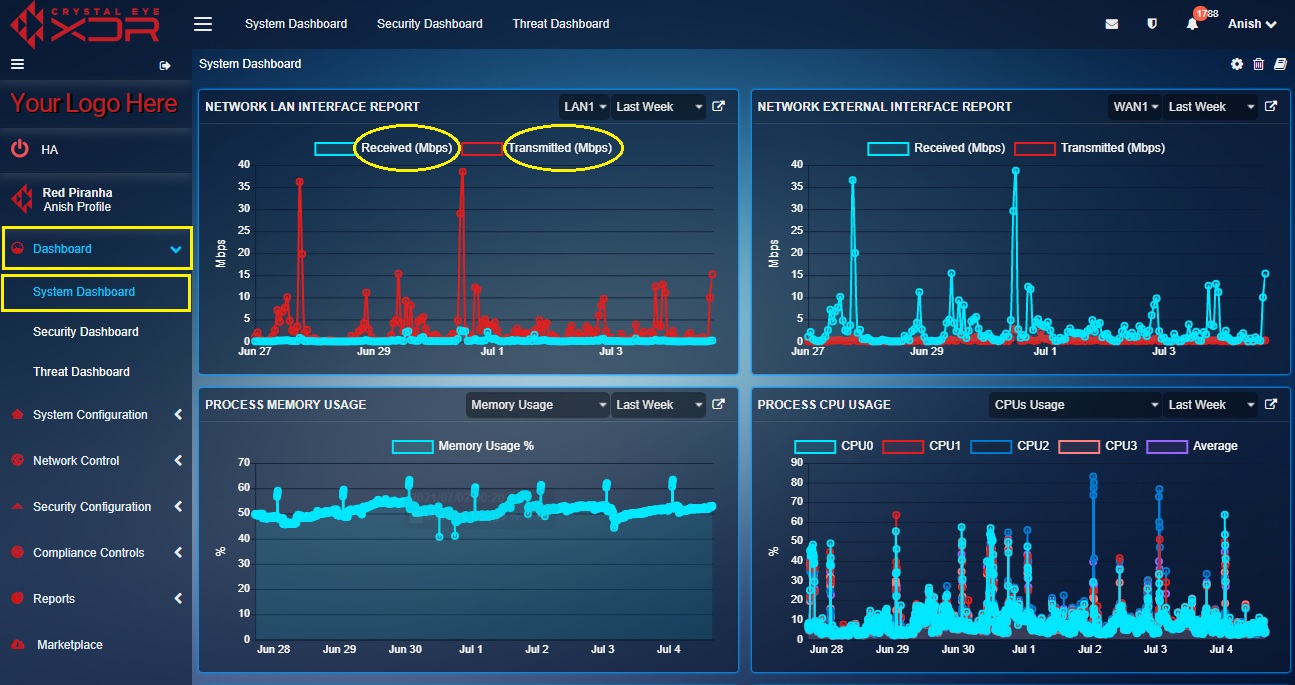
Step 1: In the LAN network interface report widget, click Received (Mbps) or Transmitted (Mbps).
Note
In the screenshot above, the graph shows details related to both data received and transmitted. However, you can eliminate any one of them for data segregation purposes as shown in the screenshot below. 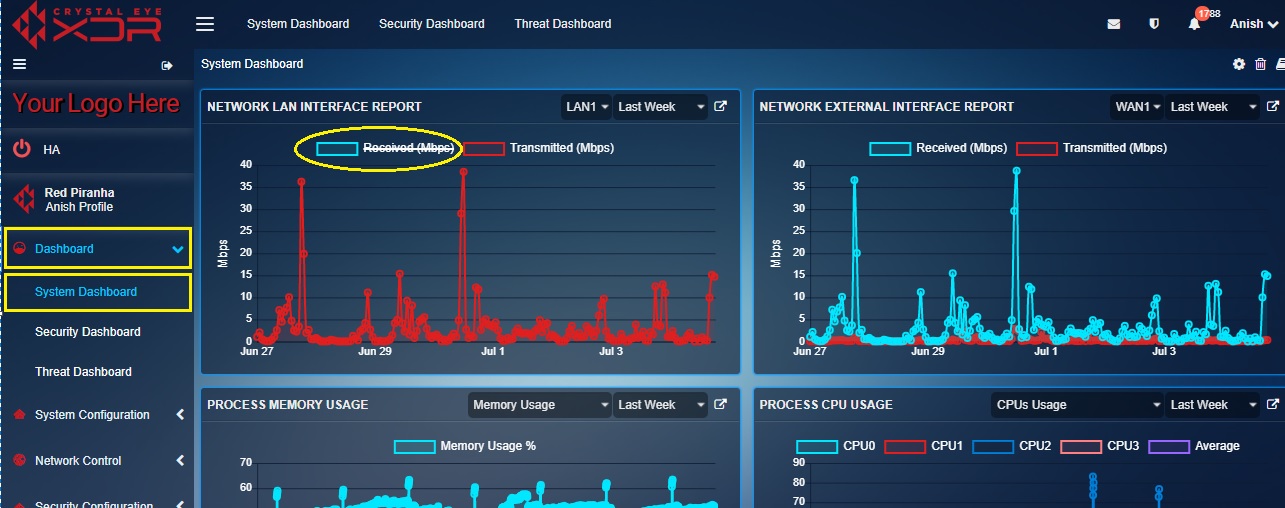
How to View a Detailed Version of Network Interface Reports?
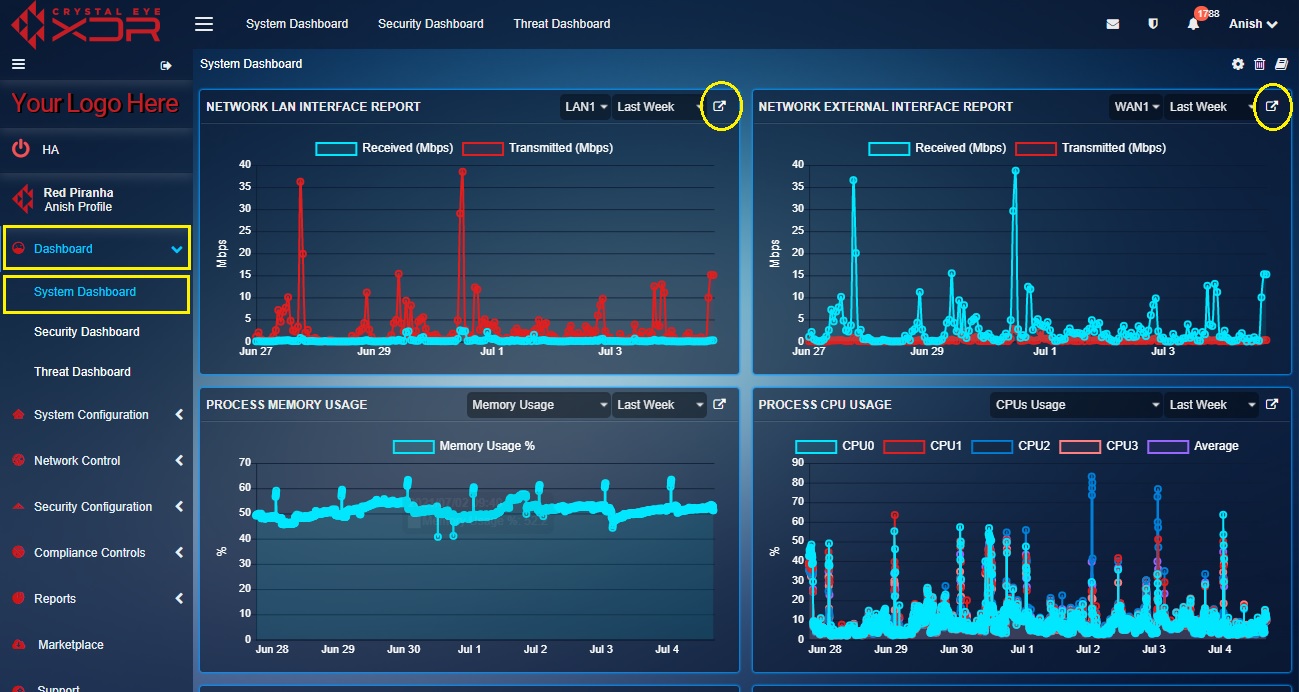
As discussed above, the System Dashboard displays only LAN Interface Report and External Interface Report. However, a detailed version of these Network Interface Reports can be viewed in the Network Interface application under the Reports section. These detailed reports would provide data transmitted and received information (including time stamp) of all the network interfaces supported by the Crystal Eye appliance both in (graphical and tabular format which can be exported in PDF format as well). Click here to know more about Network Interfaces application.
Perform the following steps to view a detailed version of Network Interface Reports.
Step 1: In the LAN network interface reports widget, click the link icon at the top-right corner of the LAN Interface widget and WAN Interface widget (refer to the screenshot below).
Note
Once you perform the above step, you will now be directed to the Network Interfaces application which is a part of the Reports category of the Crystal Eye XDR. The Network Interfaces application consists of both live data and historical data of all the interfaces of the on-premise Crystal Eye XDR. The detailed information of all the interfaces (including wireless interface) can be viewed and a PDF report of the same can be generated. The reports would provide insights on how much data was transmitted or received over a particular period of time on a particular network interface. Know more about Network Interfaces application.

