Network Threat Hunting
Overview
The Network Threat Hunting section provides an excellent network analysis platform for threat hunters and system administrators. Its ability to provide a holistic view of Network Activity, Protocol Activity and Application Activity ensures compliance with ISO 27002:2022 (Control 8.16 Monitoring Activities).
The data from network activity can help in detecting large spikes in data usage. Such abnormal spikes in network traffic, if not caused due to a rise in business activities could be due to a malicious activity in the network. Application activity can be analysed to measure application related data usage by users and devices in the network. Further on, protocol activity provides granular level visibility of the top protocols used by devices in the network.
Gaining insights from the data generated from network, protocol and application activity provides deep visibility of user device-based activities proving an excellent baseline for network threat hunting.
Navigation to Network Threat Hunting tab
Go to Dashboard > Threat Hunt Dashboard > Network Threat Hunting tab

Network Activity
The Network Activity dashboard helps in identifying highly active devices in the network that can further be investigated for its excessive data usage and packet transfer. It also displays data usage by the CE XDR network IPs and external IP addresses.
Note
The network activity report is classified into four report types namely, Top Network Users, Top Device Types, Top Network IP addresses and Top, External IP addresses. These reports can be accessed from the network activity dropdown (see screenshot below). 
The Overview Network Activity report provides the following historical data:
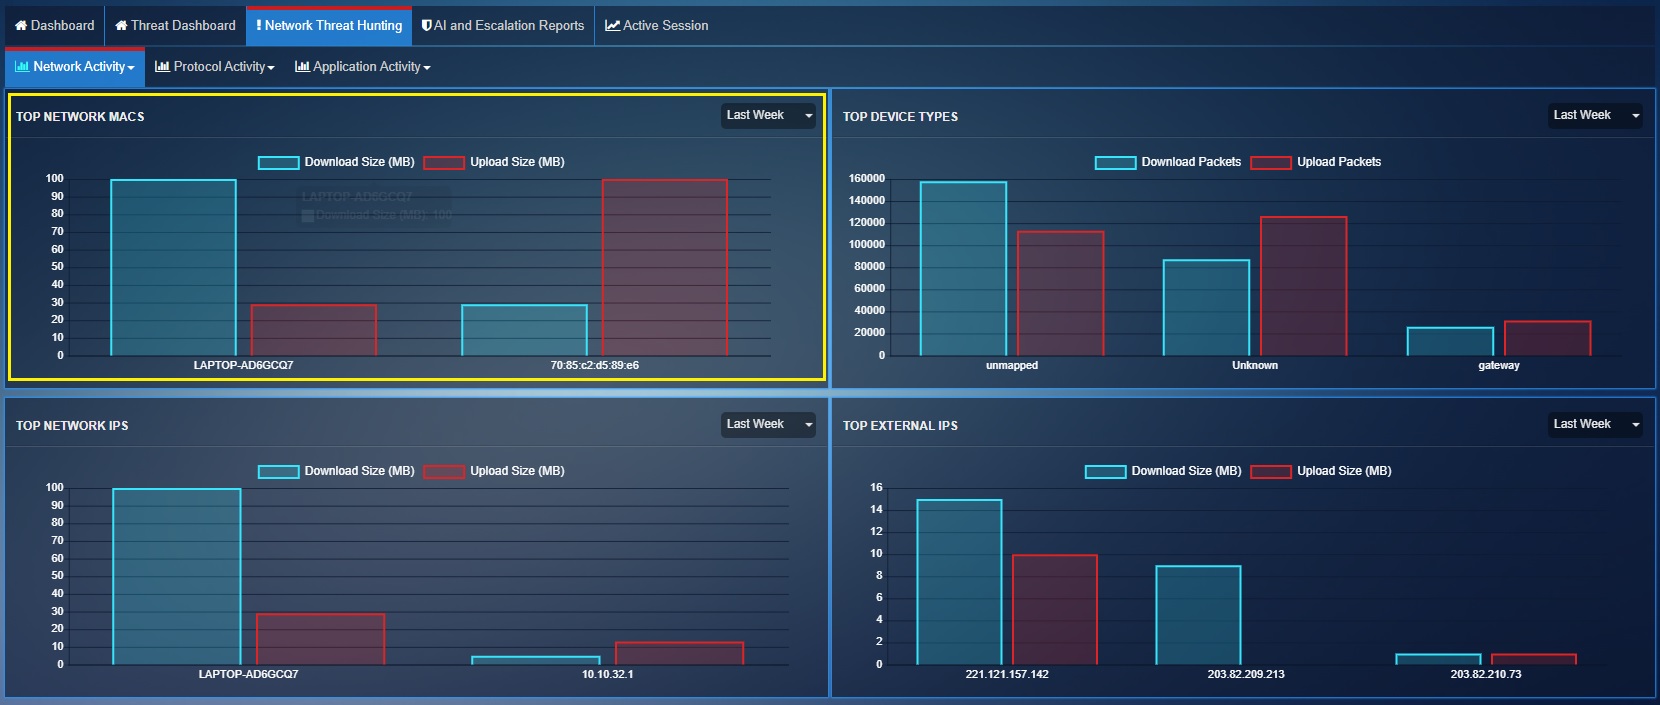
Top Network devices: Shows data usage (measured in MB) of devices in the CE XDR network. It shows MAC address of the device in the graph. Please note that the name of the device will be displayed in the graph only if the device has been mapped. Mapping a device in the CE XDR network means assigning a device name and aligning it with its MAC address. Learn how to map a device with the CE XDR here.
In the screenshot above, the graph shows the amount of data flowing to and from a given device. Historical report data can be viewed by selecting the relevant time frame from the time-period dropdown.
Top Device Types: Shows the number of packets transferred by a ‘device type’ in the network. The device type here is picked from what was specified while mapping the device in the Network Map app. Know more about how devices are mapped in the CE XDR here.
In the above screenshot, the graph shows the amount of data packets flowing to and from a given device type (example – laptops, desktops, servers etc). Historical report data can be viewed by selecting the relevant time frame from the time-period dropdown.
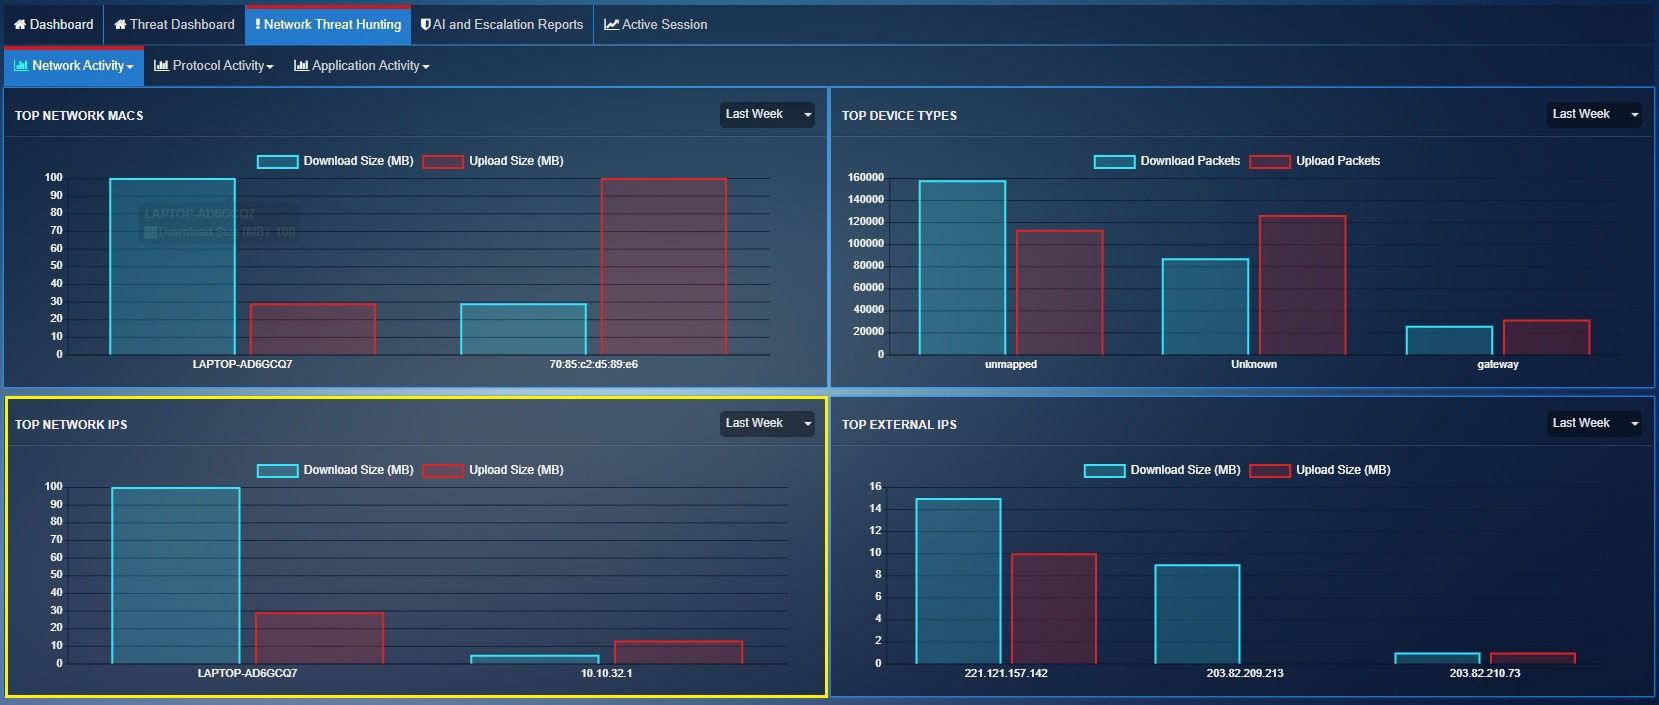
Top Network IP addresses: Shows data usage (measured in MB) by top 10 internal IP addresses in the Crystal Eye XDR network.
In the above screenshot, the table shows the amount of data flowing to and from a given device IP address. Historical report data can be viewed by selecting the relevant time frame from the time-period dropdown.
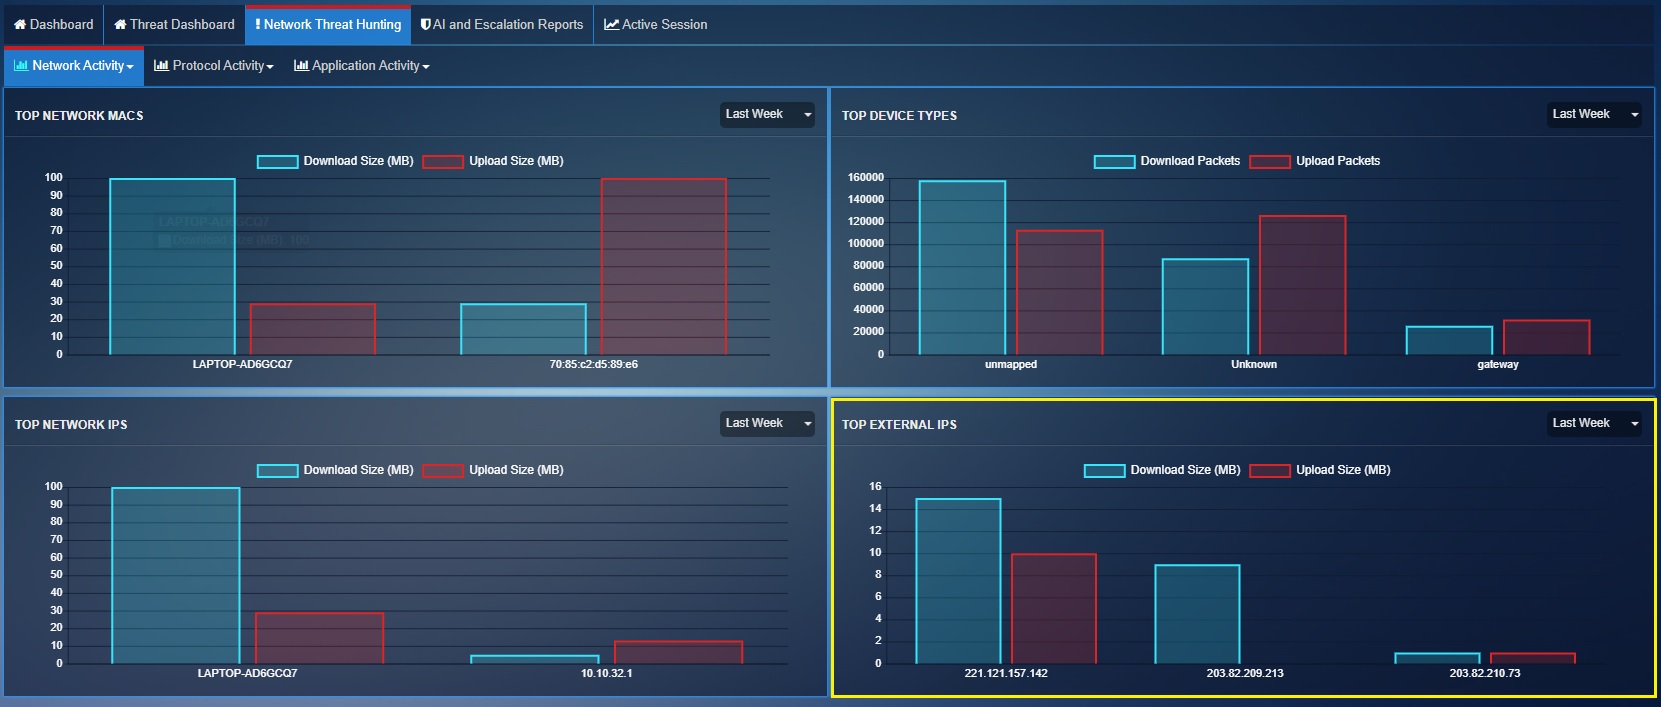
Top External IP addresses: Shows data usage (measured in MB) by external devices accessing the CE XDR network.
In the above screenshot, the graph shows the amount of data flowing to and from a given external device IP address. Historical report data can be viewed by selecting the relevant time frame from the time-period dropdown.
Protocol Activity
The Protocol Activity dashboard provides a visual representation of the protocols used in the CE XDR network. The dashboard can be adjusted to display an overview report as well as a detailed protocol activity report.
Note
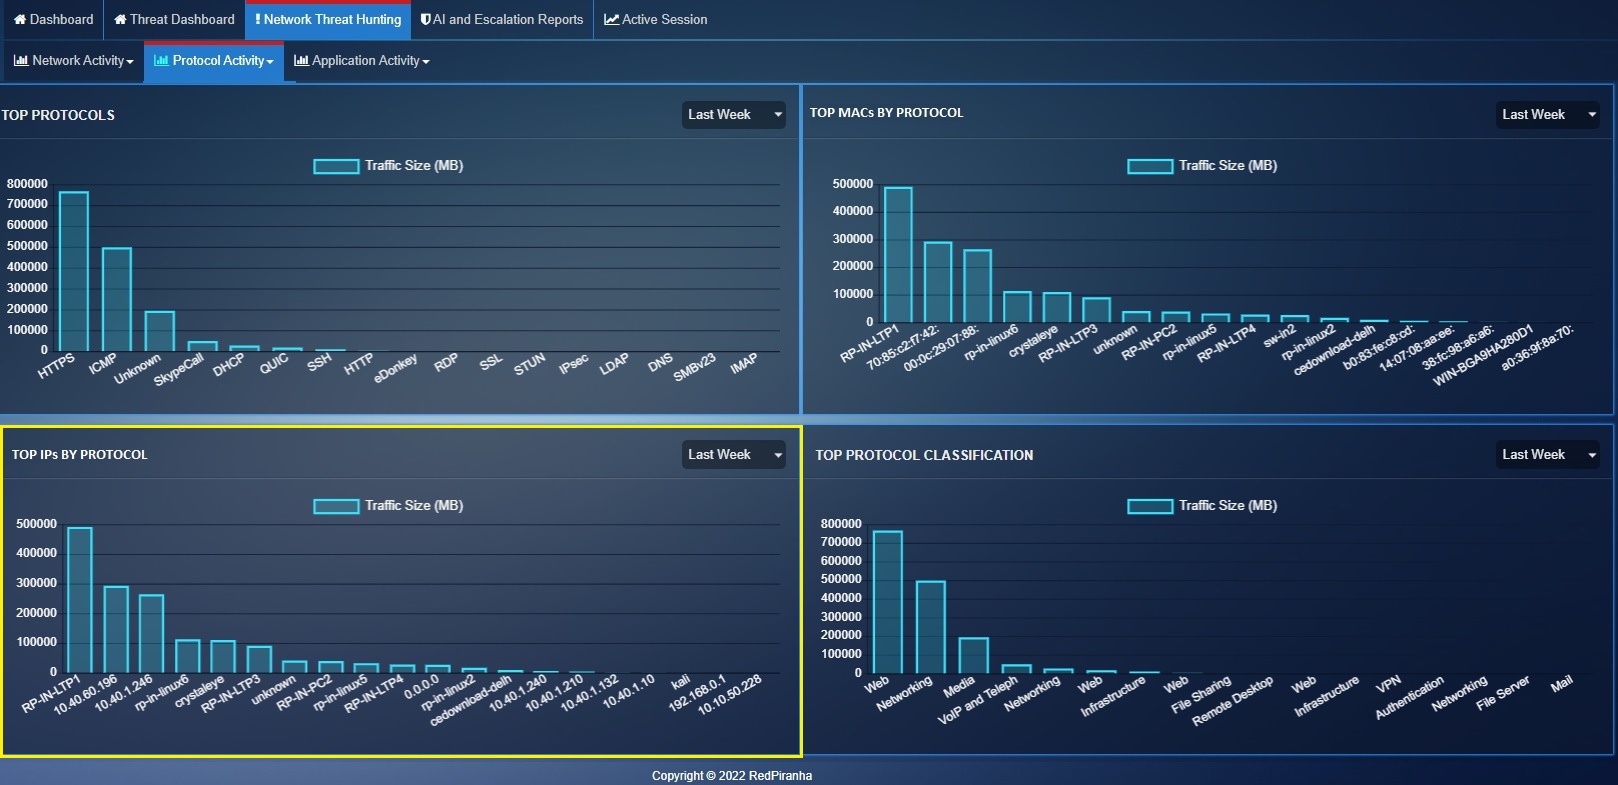
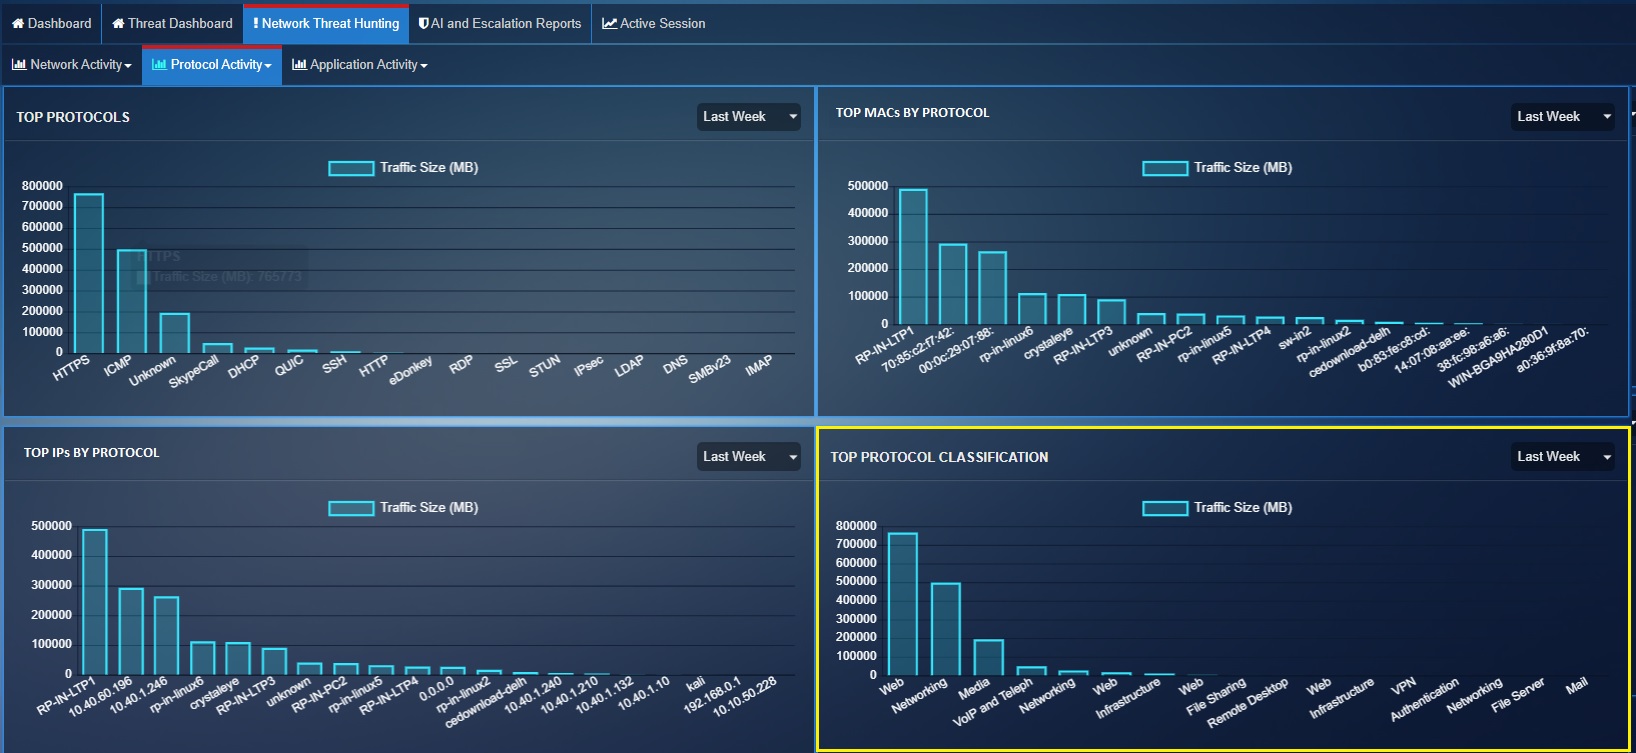
The Protocol Activity report is classified into four report types namely, Top Protocols, Top MACs by Protocol, Top IPs by Protocol, and Top Protocol Classification. These reports can be accessed from the protocol activity dropdown (see screenshot below). 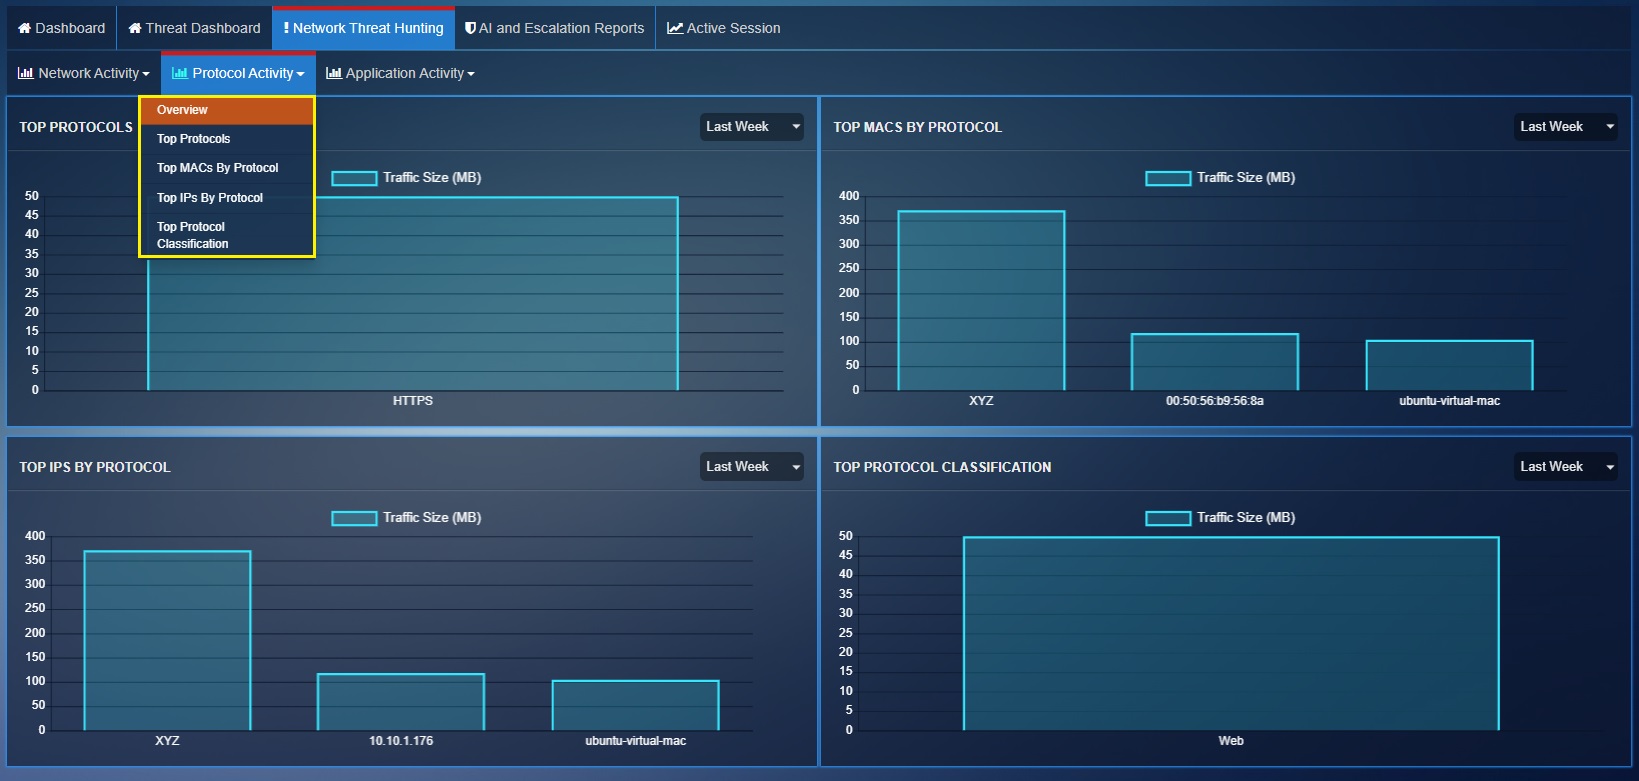
The Overview Protocol Activity Report provides the following historical data:
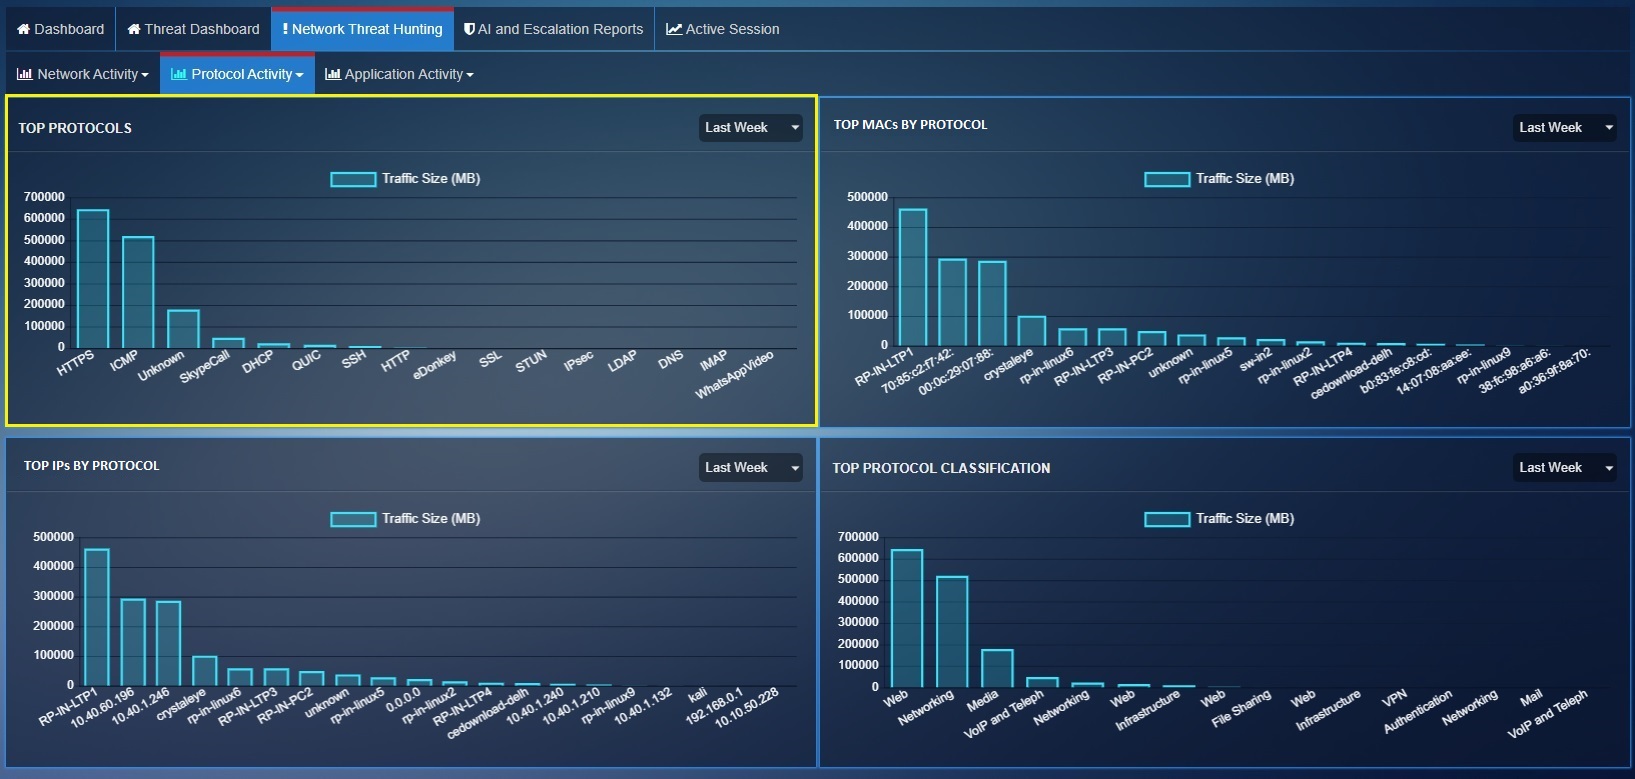
Top Protocols: Shows summarized data downloaded (measured in MB) by each protocol in the CE XDR network.
Top MAC Address by Protocol: Shows the data downloaded (measured in MB) using each protocol per device (represented by its MAC address) in the CE XDR network. Please note that you will see nickname of the device if you have mapped it with the CE XDR. Click here to know how to map a device with the CE XDR.
Top IPs By Protocol: Shows the data downloaded (measured in MB) using each protocol per device (represented by its IP address) in the CE XDR network. Please note that you will see nickname of the device if you have mapped it with the CE XDR. Click here to know how to map a device with the CE XDR.
Top Protocol Classification: Shows the summarized data (measured in MB) downloaded per each protocol category in the CE XDR network.
Application Activity
This section allows system administrators to track the top applications accessed through devices connected to the Crystal Eye XDR network.
Note
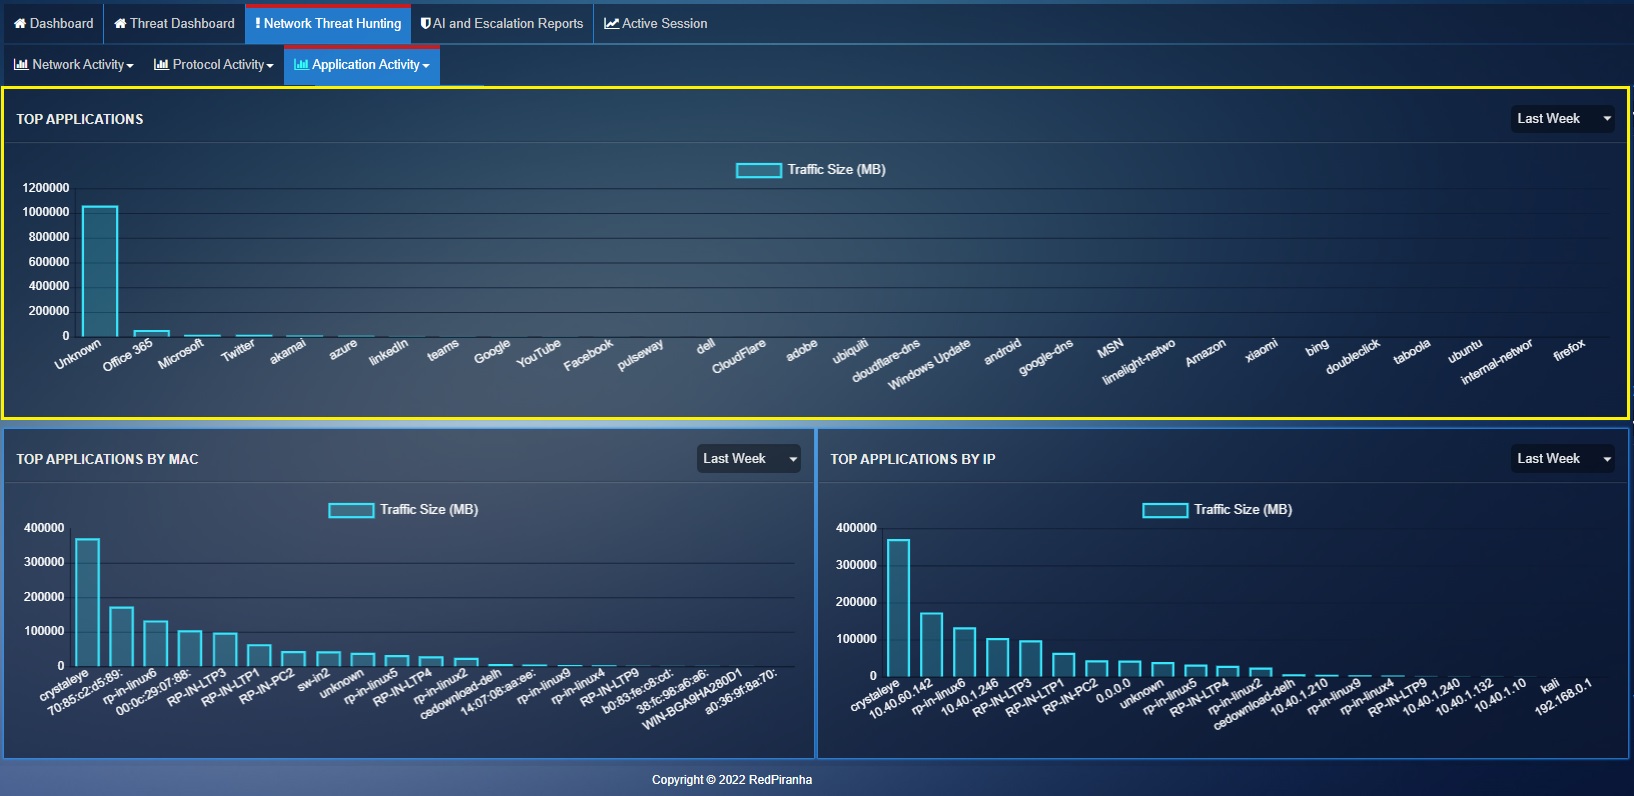
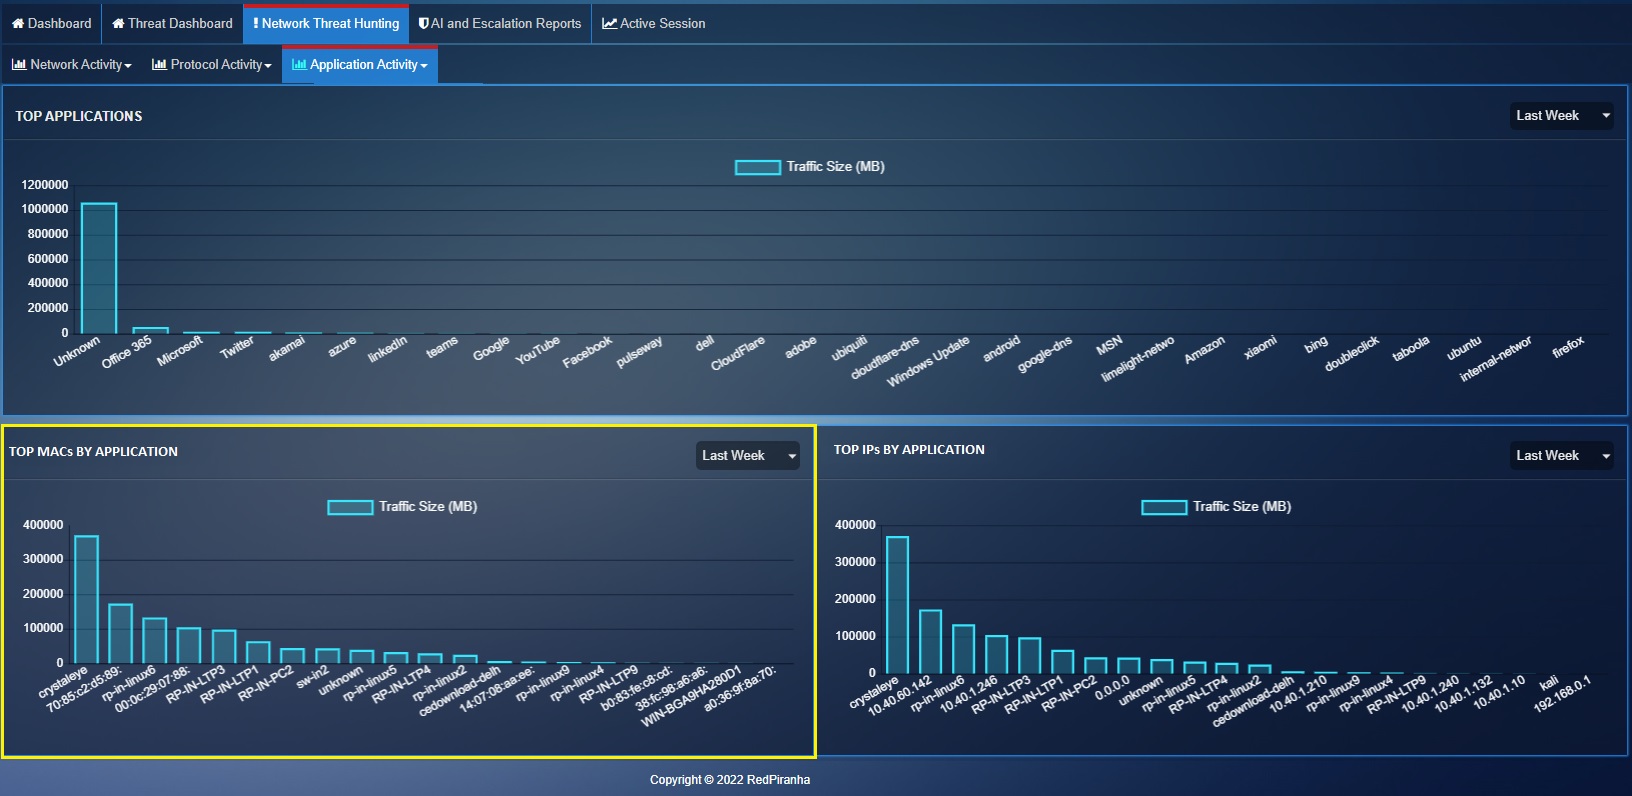
The Application Activity report is classified into four report types namely, Top Applications, Top MACs by Application, Top IPs by Protocol, and Top IPs by Application. These reports can be accessed from the application activity dropdown (see screenshot below).
The Overview Application Activity report provides the following historical data:
Top Applications: Shows the top applications based on the traffic size downloaded (measured in MB) by each application in the CE XDR network.
Top MACs by Application: Shows the top MAC addresses of devices in the Crystal Eye XDR network as per the application related traffic size (measured in MB) handled by them. Please note that you will see nickname of the device if you have mapped it with the CE XDR. Click here to know how to map a device with the CE XDR.
Top IP Addresses by Application: Shows the top IP addresses of devices in the Crystal Eye XDR network as per the amount of application related traffic size (measured in MB) handled by them. Please note that you will see nickname of the device if you have mapped it with the CE XDR. Click here to know how to map a device with the CE XDR.
