IDPS Alerts Statistics
Overview
The IDPS Alerts Statistics widget is a graphical representation showing the total number of IDPS related alerts, netflow events, DNS requests, SSH connections and top alerts rule SID triggered on a particular day at a particular time. The data can be adjusted and can be displayed according to the desired time period which can be selected from the dropdown.
The 6 types of graphs that can be displayed in this widget are related to Alert, Flow, DNS, SSH and Top Alerts Rule SID. These graphs can also be viewed in the Reports section under the IDPS Alerts tab of the Threat Dashboard.
How to view different graph types related to Alert, Flow, DNS, SSH and Top Alerts Rule SID?
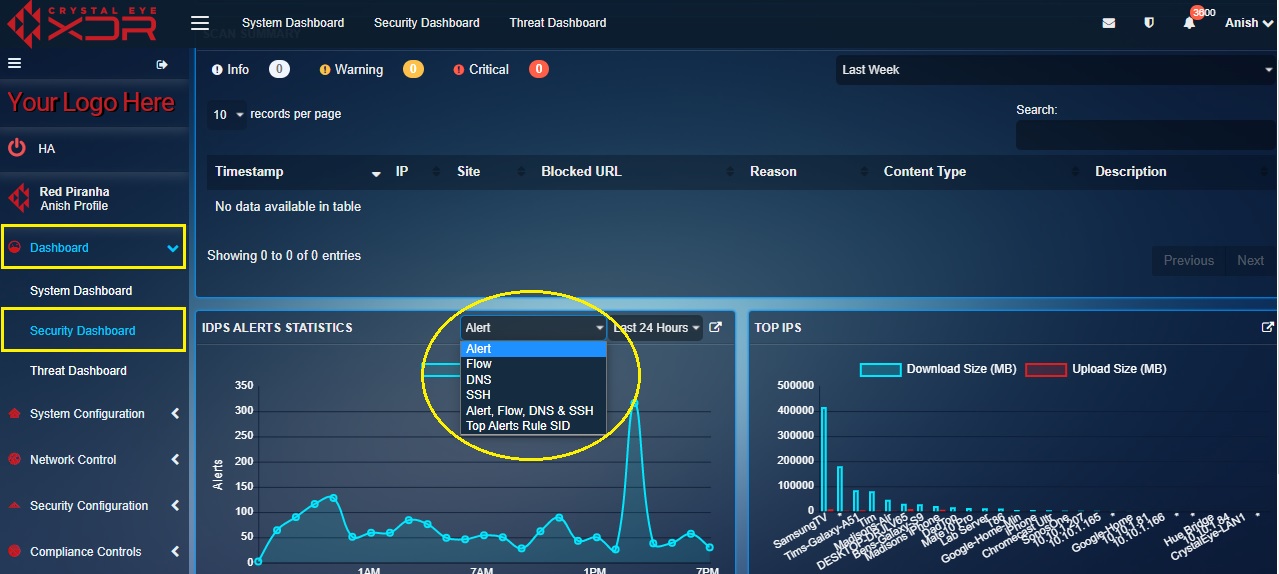
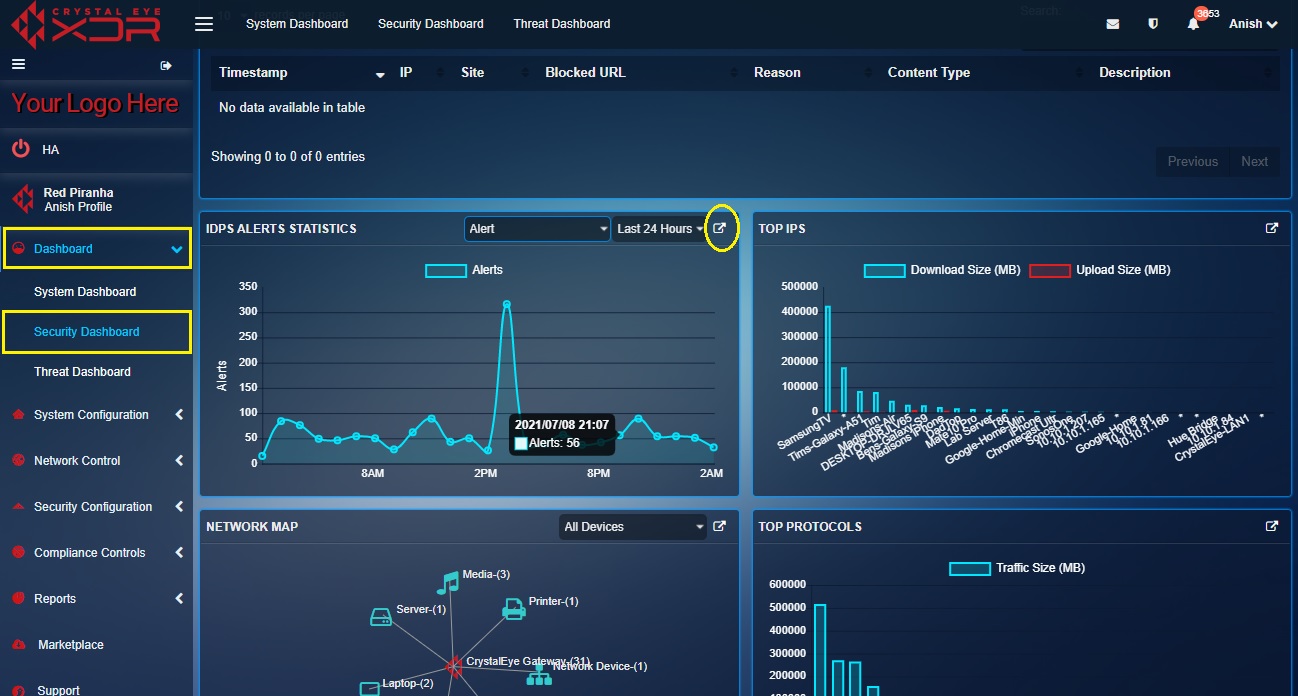
There are two dropdowns in the top panel of the IDS/IPS alerts statistics widget which can be used to control the data displayed here. Using the first dropdown (refer to the screenshot below) the CE administrator can select the required data type to display corresponding information in the graph related to Alert, Flow, DNS, SSH and Top Alerts Rule SID.
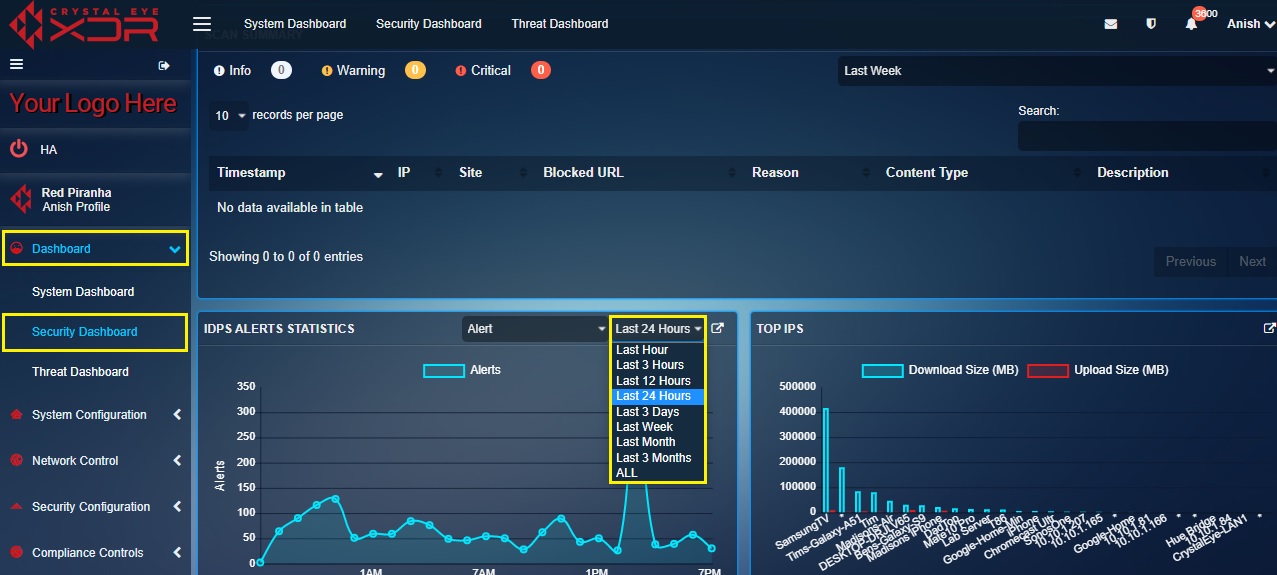
The second dropdown can be used to select a time range to further filter the report. This helps in segregating data and analysing alert information belonging to a particular time range.
How to Interpret the Graphical Data Related to Alert in the IDPS Alerts Statistics Widget?
Step 1: In the IDPS Alerts Statistics widget, select Alert from the first dropdown in the top panel.
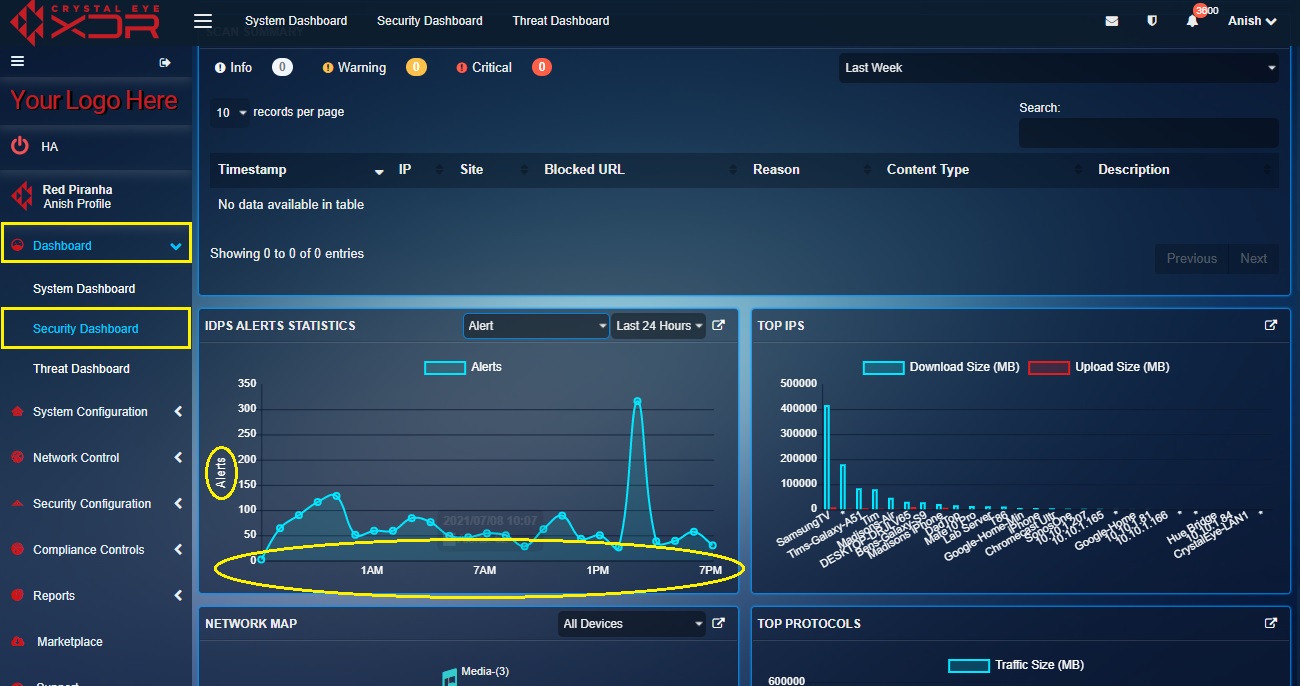
Step 2: You will now see the Alerts graph. The y-axis shows the number of alerts and the x-axis shows the time.
Note
Point the cursor to the graph points (as mentioned in the screenshot below) and you will see a pop-up showing the number of alerts recorded at that particular date and time. 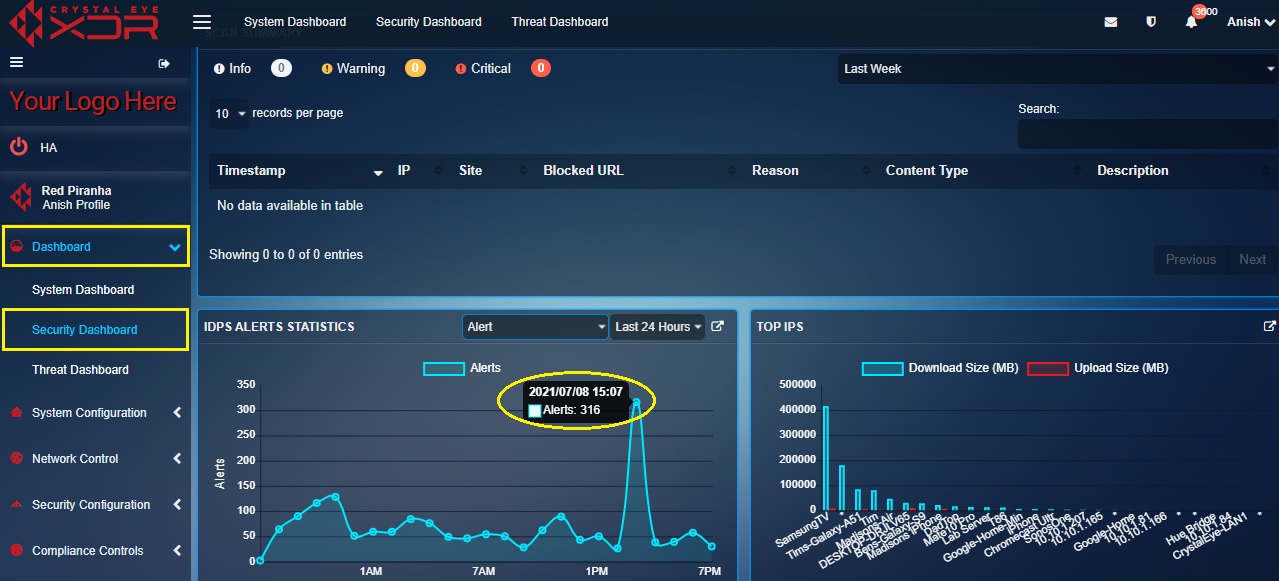
How to Interpret Graphical Data Related to Flow Count in the IDPS Alerts Statistics Widget?
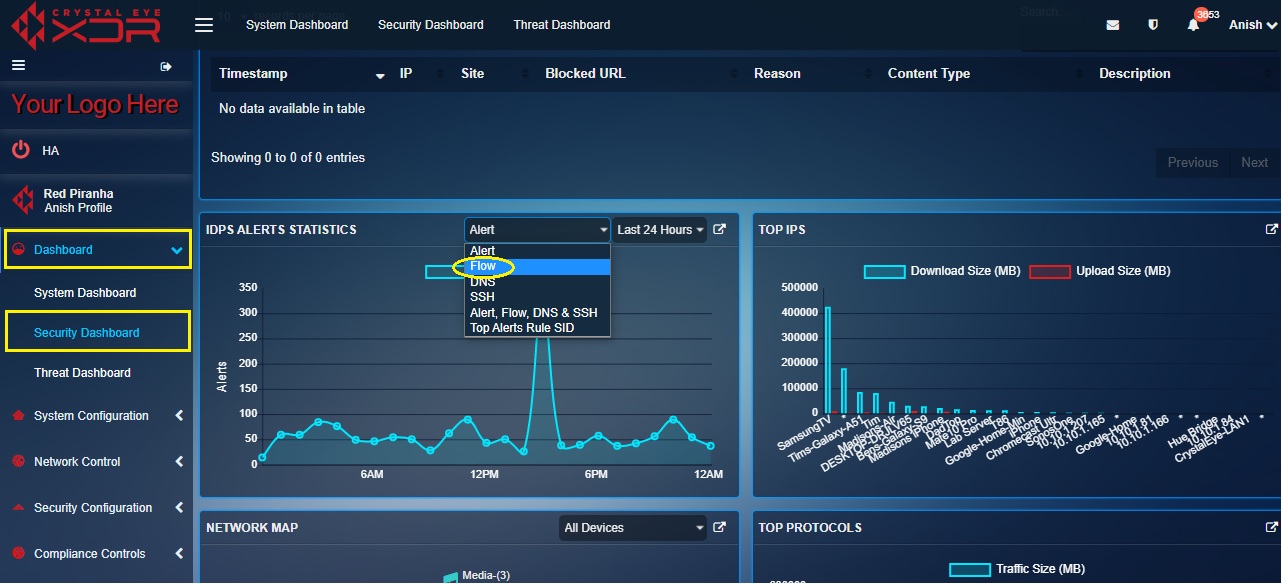
Step 1: In the IDPS Alerts Statistics widget, select Flow from the first dropdown in the top panel.
Step 2: You will now see the Flow graph. The y-axis shows the number of flow counts and the x-axis shows the time.
Note
Point the cursor to the graph points (as mentioned in the screenshot above) and you will see a pop-up showing the number of Netflow counts recorded by the Crystal Eye appliance at a particular date and time.
How to interpret graphical data related to the number of DNS requests recorded by the Crystal Eye XDR?
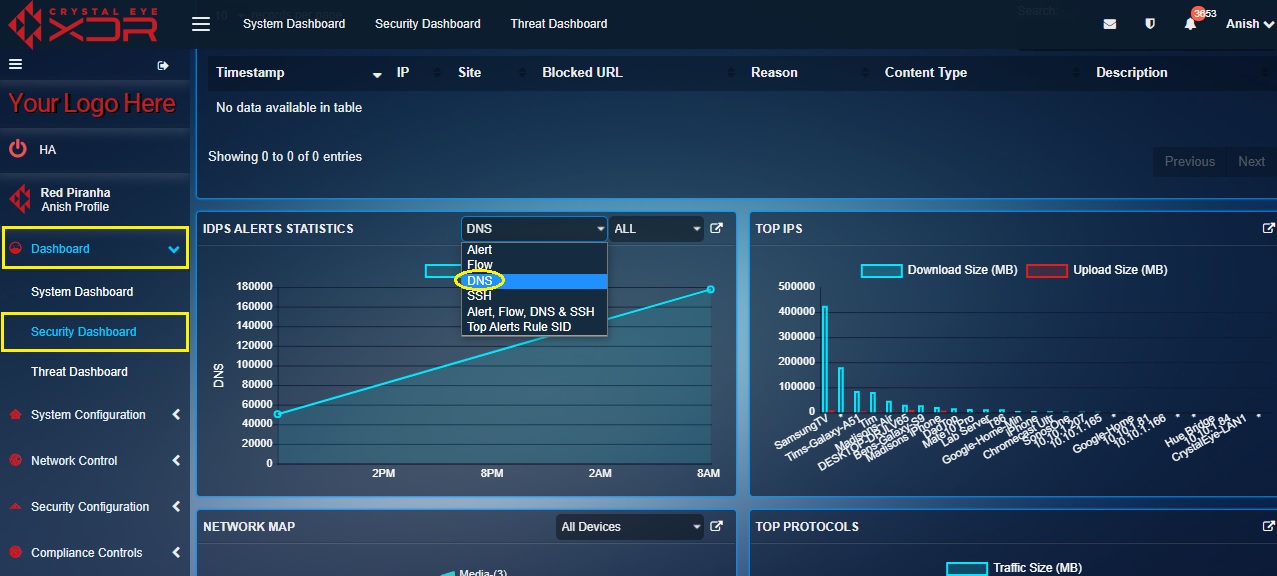
Step 1: In the IDPS Alerts Statistics widget, select DNS from the first dropdown in the top panel.
Step 2: You will now see the DNS requests graph. The y-axis shows the number of DNS requests and the x-axis shows the time.
Note
Point the cursor to the graph points (as mentioned in the screenshot above) and you will see a pop-up showing the number of DNS requests recorded by the Crystal Eye XDR at that particular date and time.
How to interpret graphical data related to SSH connections recorded by the Crystal Eye XDR?
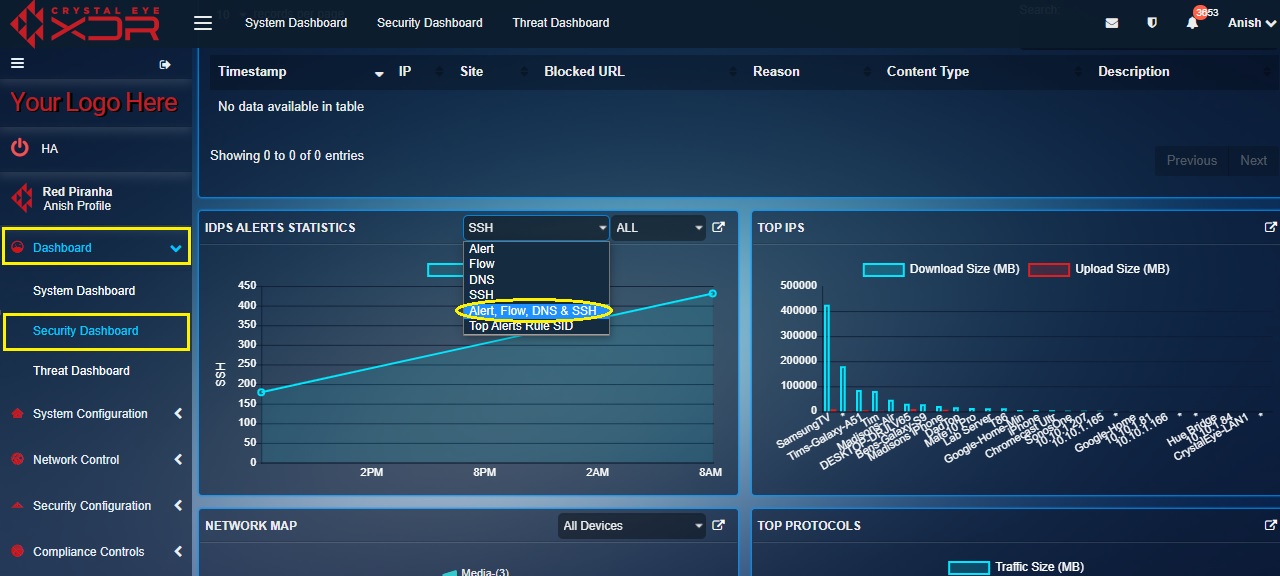
Step 1: In the IDPS Alerts Statistics widget, select SSH from the first dropdown in the top panel.
Step 2: You will now see the SSH graph. The y-axis shows the number of SSH connections and the x-axis shows the time.
Note
Point the cursor to the graph points (as mentioned in the screenshot below) and you will see a pop-up showing the number of SSH connections recorded by the Crystal Eye appliance at a particular date and time. 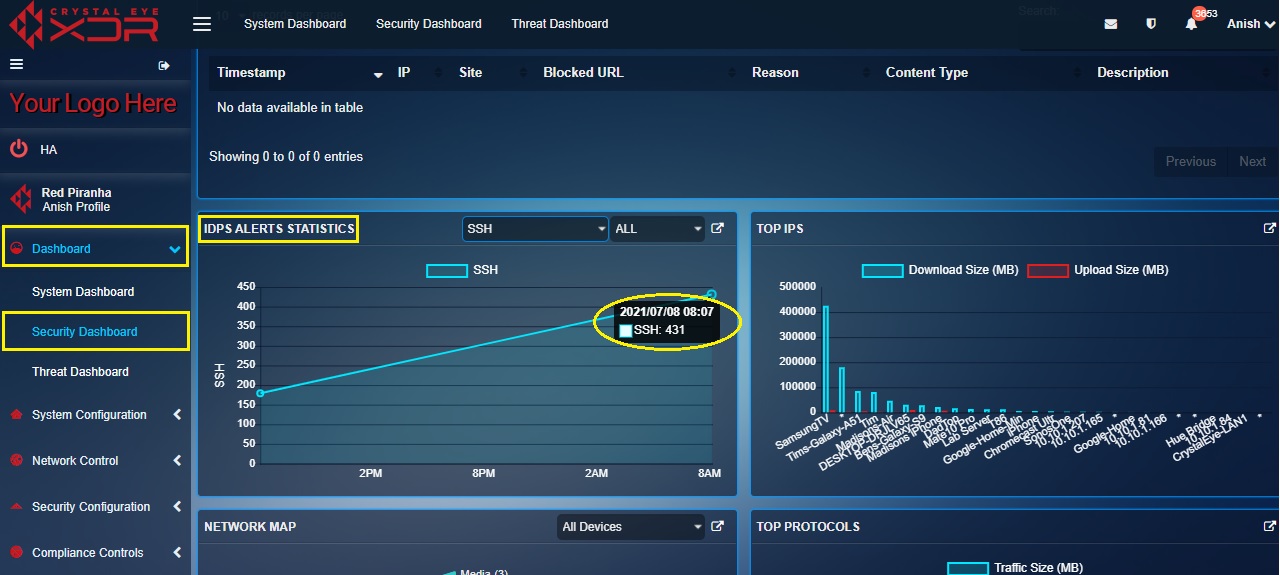
How to view Alert, Netflow Count, DNS Requests, and SSH Connections on a single graph?
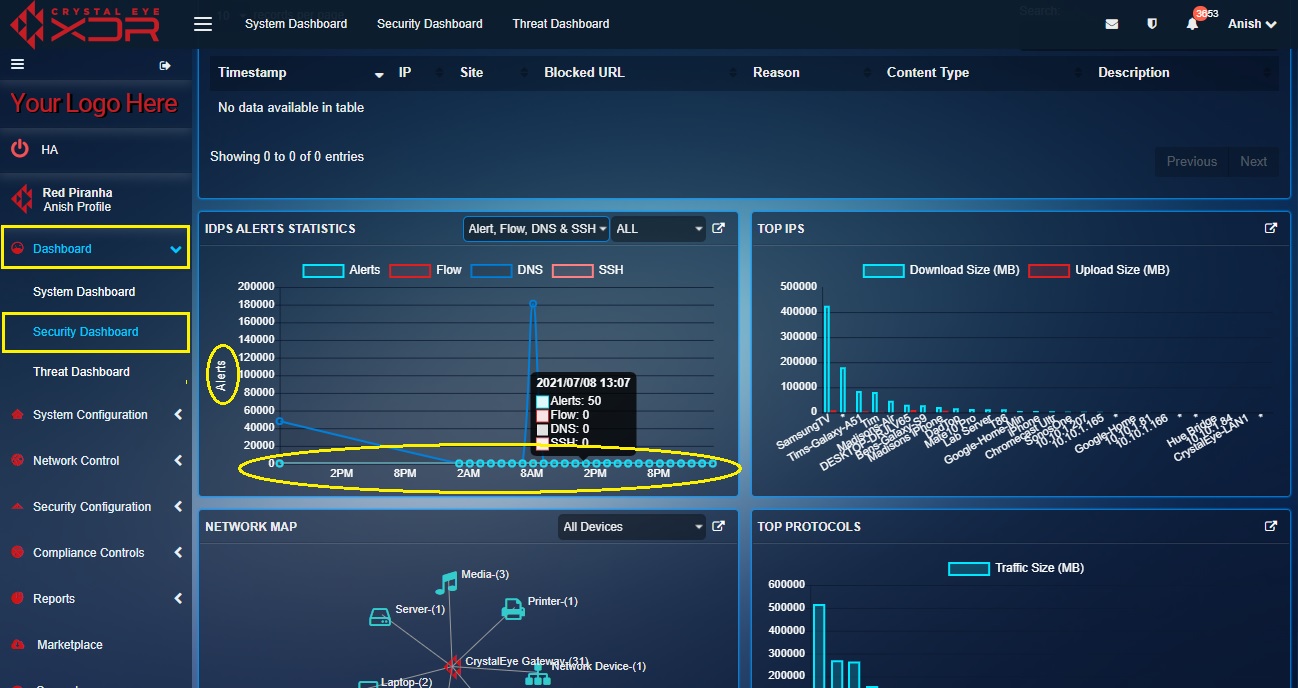
Step 1: In the IDPS Alerts Statistics widget, select Alert, Flow, DNS & SSH from the first dropdown in the top panel.
Step 2: You will now see the combined graph of Alert, Flow, DNS and SSH. The y-axis shows the Alerts, Netflow count, DNS requests and SSH a connection recorded by the CE appliance and the x-axis shows the time.
How to view the Top Alerts Rule SID graph in the IDPS Alerts Statistics widget?
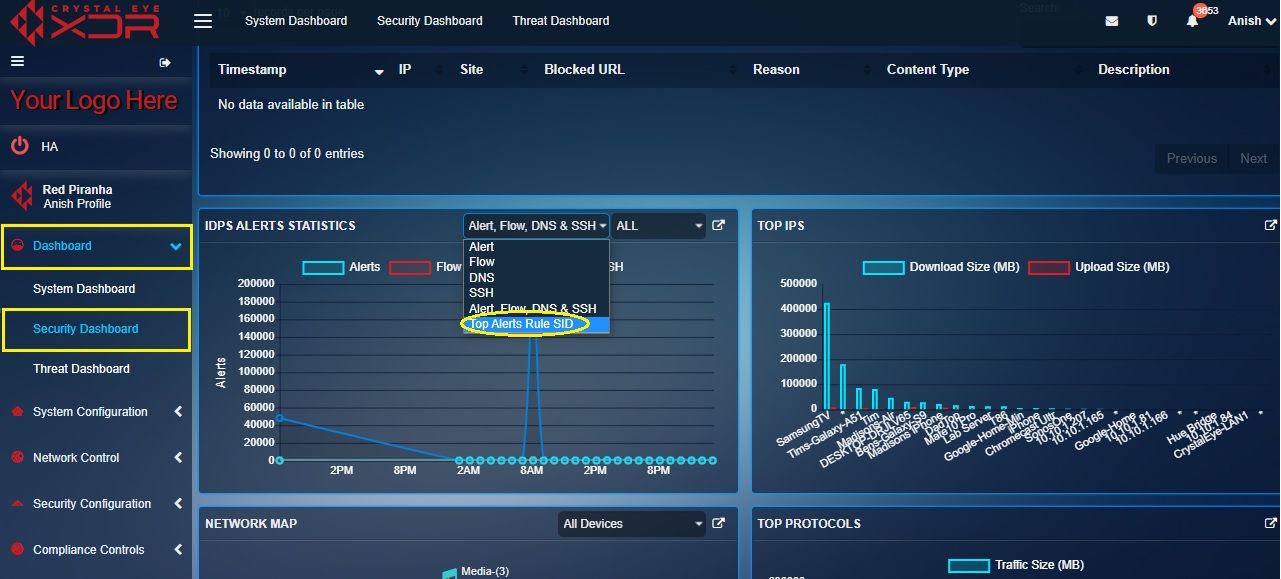
Step 1: In the IDPS Alerts Statistics page, select Top Alerts Rule SID from the first dropdown.
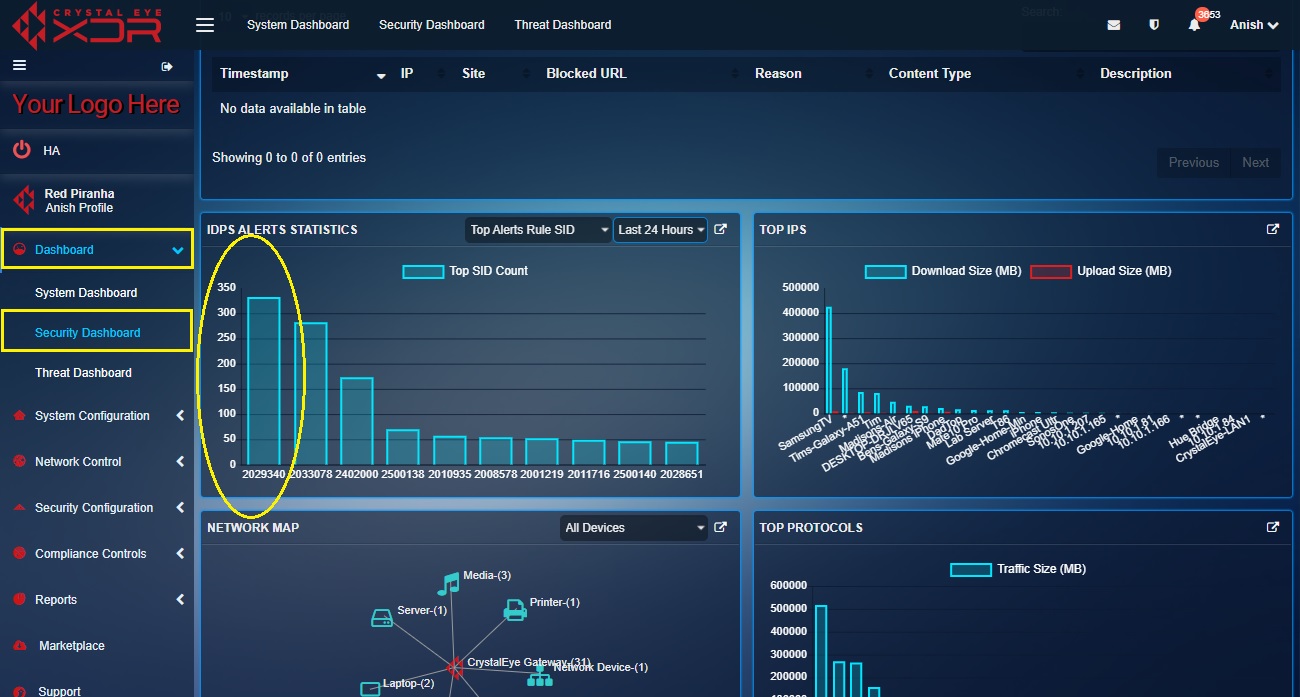
Step 2: You will now see the Top Alerts Rule SID graph. The y-axis shows the number of times an SID rule was triggered and the x-axis shows the Signature Identification Number (SID).
Note
In the screenshot above, SID number 2029340 on the x-axis of the graph shows that it was triggered over 300 times in the past 24 hours.
How to fetch in-depth information about the IDPS Alerts from Crystal Eye’s Security Dashboard?
Step 1: In the Security Dashboard, click the link icon in the top-right corner of the IDPS Alerts widget.
Note
You will now be directed to the IDPS Alerts tab of the Thread Dashboard. Here you will gain access to in-depth information about Alerts, Escalated Alerts, Events, AV Alerts, Escalated AV Alerts, Alerts Report, Netflow Report, DNS Report, and SSH Report. The CE XDR administrator also has the leverage to export and send a Summary report to any email address. The report can also be scheduled to be delivered to an email address on a daily, weekly and monthly basis or can be sent instantly as well. All these reports can be filtered according to a particular time range.
