Network Diagnostic Tool
Overview
The Network Diagnostic Tool app provides option to the administrator to access some frequently used networking tools like Ping and Tracepath. The app is built to provide a great deal of networking related information to the administrator. The features of this tool is widely used to find causes of glitches in the network interface. The Network Diagnosis Tool provides enhanced capabilities to Ping which helps to analyse the host and check whether it’s responding. The tracepath feature of the network diagnostic tool is used by Crystal Eye XDR administrators to trace the journey of a data that it undertakes to reach a designated destination.
Installation
The Network Diagnostic Tool is not installed by default and must be installed from the Marketplace.
Navigation to the Network Diagnostic Tool
Left-hand Navigation Panel > Network Control > Network Diagnostic Tool 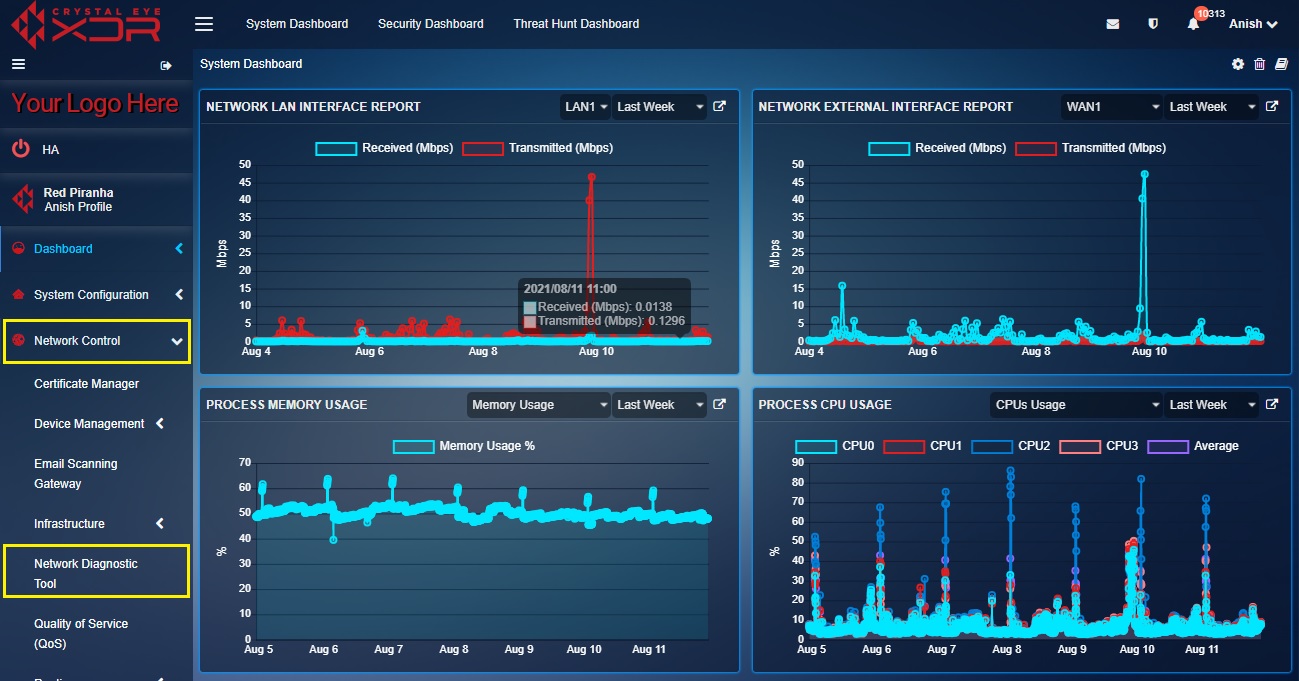
SD-WAN Monitoring
As businesses rapidly embrace digital transformation, managing and securing a complex, distributed network infrastructure has become increasingly difficult. Organizations today rely heavily on Virtual Private Networks (VPNs) and Software-Defined Wide Area Networks (SD-WAN) to connect remote offices, hybrid workers, and cloud environments. While these technologies provide flexibility, they also introduce visibility challenges, performance uncertainties, and incident response delays.
Crystal Eye addresses these modern pain points with a fully integrated SD-WAN Monitoring application. Built to track the health of VPN connections using IPSec and WireGuard protocols, this application empowers network administrators with the tools to proactively detect disruptions, maintain service-level agreements (SLAs), and streamline incident management.
What Crystal Eye SD-WAN Monitoring Tool Solves?
The core challenge with most enterprise VPNs is the lack of centralized, real-time monitoring. Admins often find themselves blind to tunnel degradation, jitter, packet loss, or outages until end users report them. The Crystal Eye SD-WAN Monitoring solution solves this by continuously monitoring tunnel endpoints and alerting admins the moment SLA thresholds are breached.
Key problems addressed include: - Inability to visualize VPN performance trends over time. - Manual, reactive incident handling. - Lack of SLA enforcement on critical remote connections. - Fragmented alerting mechanisms. - No integrated reporting to track compliance or performance. The SD-WAN Monitoring application solves this with real-time graphs, configurable profiles, and intelligent alerting that integrates into the Crystal Eye Security Operations Centre (CESOC).
Step 1: Accessing the Monitoring Tool
To begin monitoring VPN health:
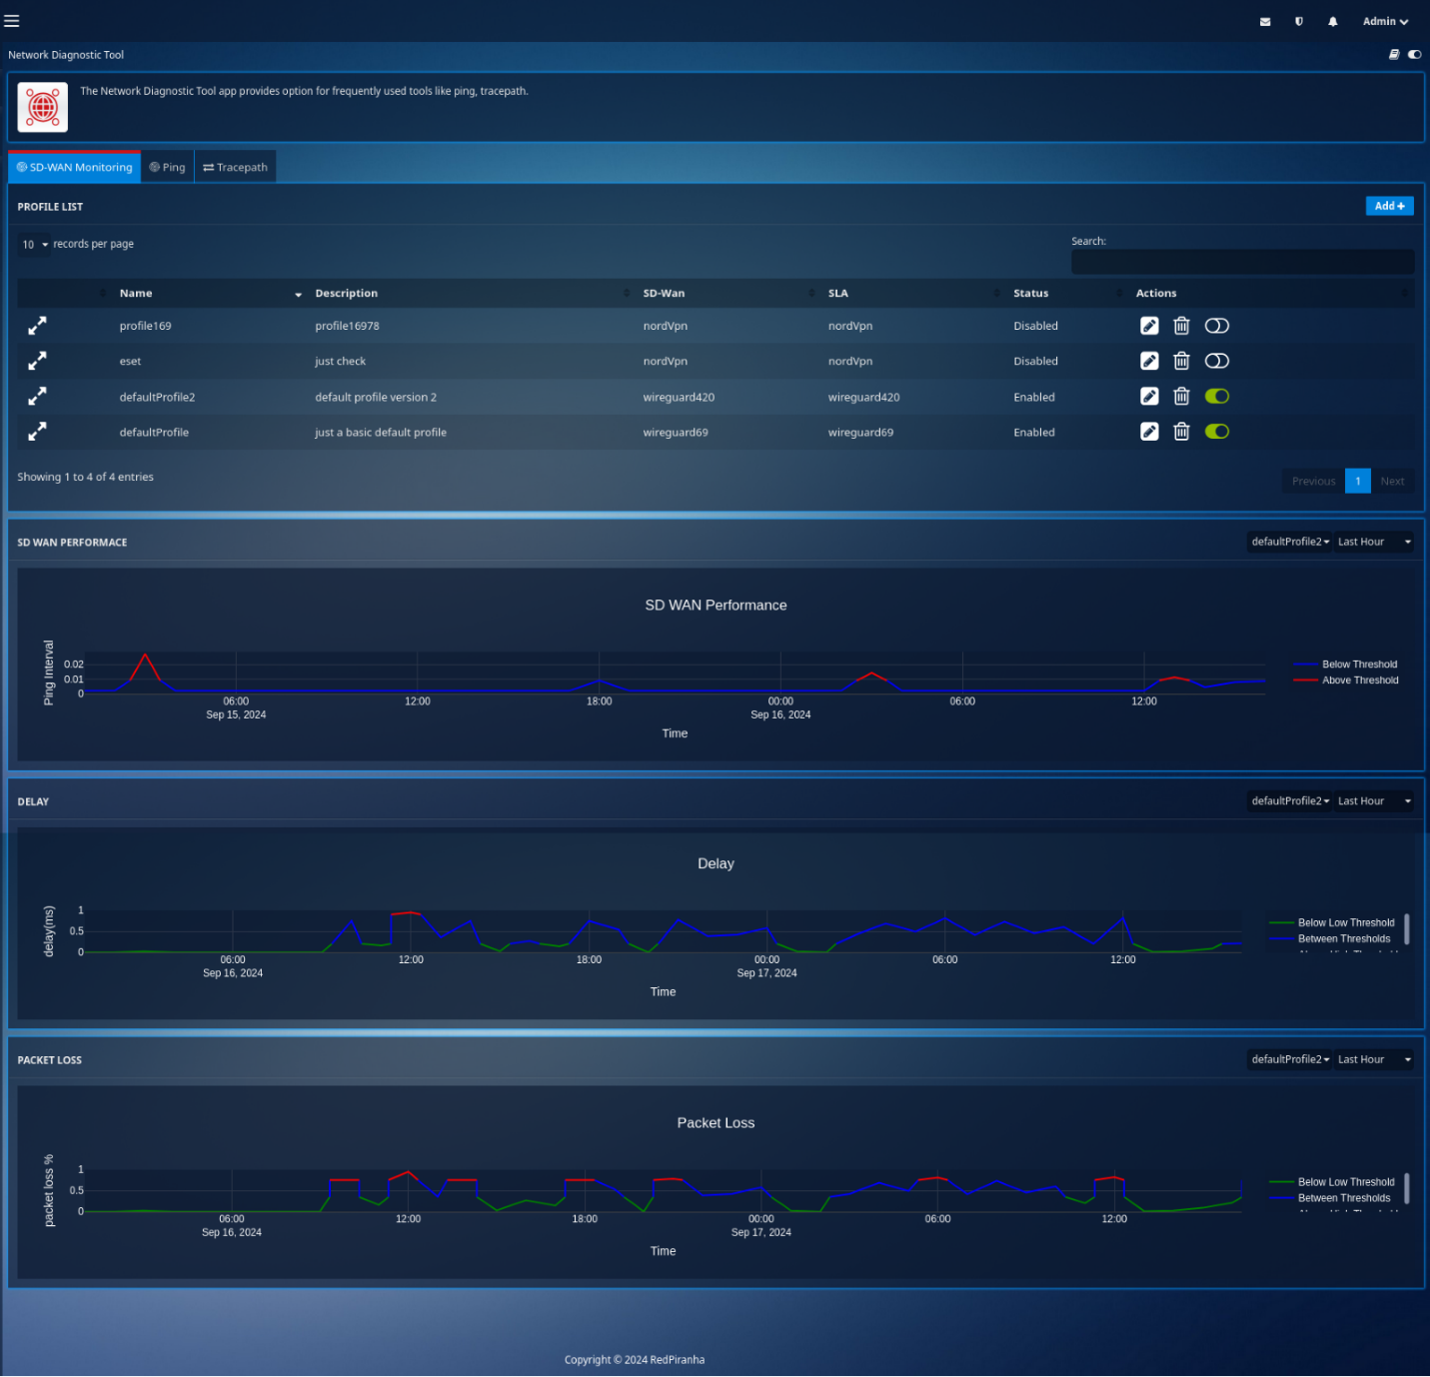
- Log in to the Crystal Eye interface with administrator credentials.
- Navigate to the menu: Network Control > Network Diagnostic Tool.
- Click on the SD-WAN Monitoring tab.
This tab will present two main components: SD-WAN Profiles and SD-WAN Performance.
Step 2: Creating a New SD-WAN Profile
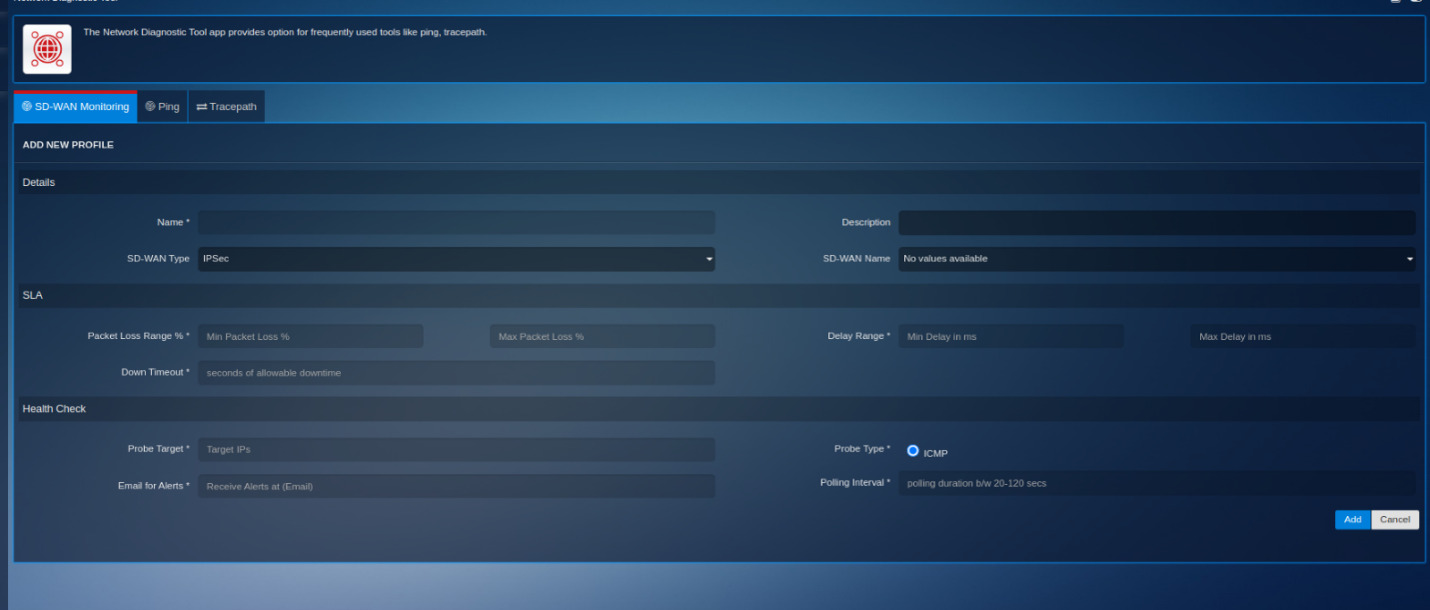
A profile defines the monitoring parameters for a specific VPN tunnel. To create one:
- Click the Add Profile button.
- Provide a name and description.
- Choose the SD-WAN Type: either IPSec or WireGuard.
- Select the appropriate VPN tunnel name from the dropdown list.
- Set the Probe Type (currently only ICMP is supported).
- Define the IP addresses to probe these should be part of the remote LAN or allowed subnets.
- Enter the email addresses for alert recipients in the "Mailto" field.
- Configure SLA thresholds: a. Down Time: Maximum allowable time without a response (e.g., 30 seconds). b. Delay High/Low: Acceptable latency boundaries (e.g., 450ms high / 400ms low). c. Packet Loss High/Low: Acceptable packet loss percentage (e.g., 30% / 20%). d. Polling Interval: Frequency of probe checks (e.g., every 20 seconds).
- Save the profile to activate monitoring.
Step 3: Monitoring Performance in Real Time
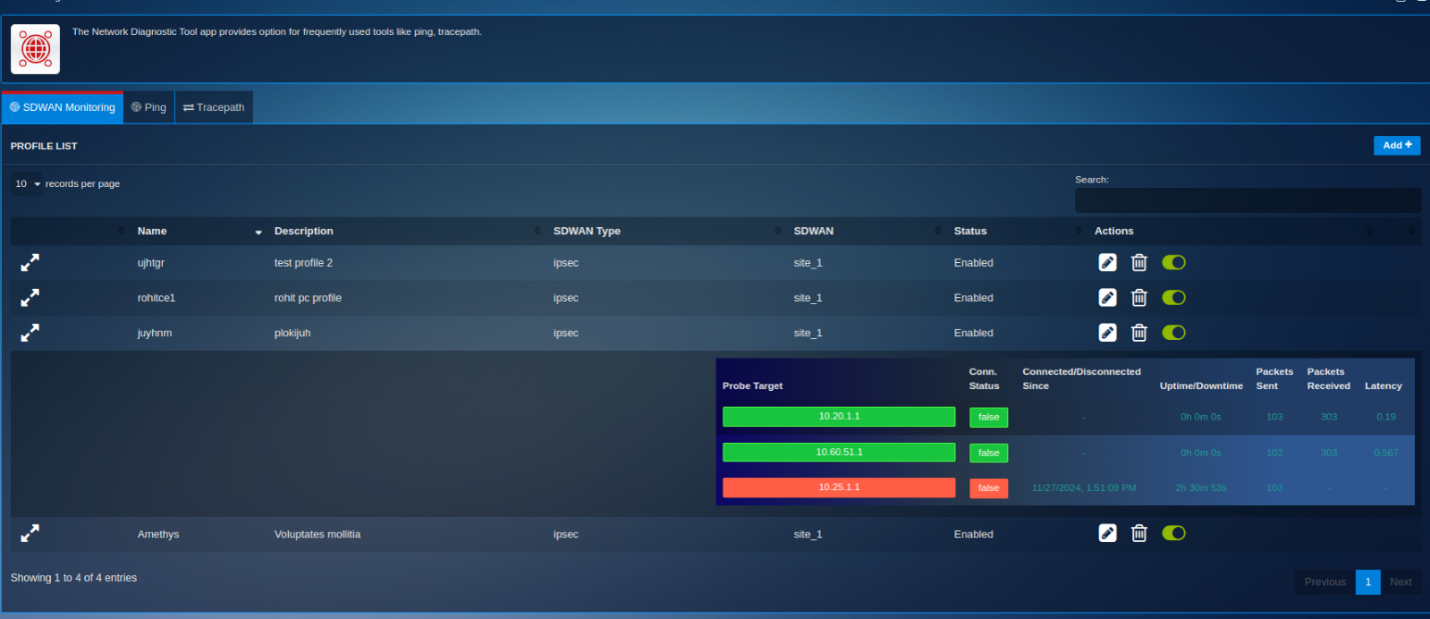
Once profiles are added, the "SD-WAN Performance" section displays a timeline graph for each profile. These graphs reflect delay, loss, and downtime parameters over time. The performance graph uses a color-coded system:
- Green indicates SLA compliance.
- Yellow warns that metrics are nearing violation thresholds.
- Red signifies that SLA violations have occurred. The system aggregates the data for each profile, enabling users to visually analyze the health trends of their VPN tunnels.
Step 4: Alerting and Notifications
Crystal Eye SD-WAN Monitoring features an automated alerting mechanism for SLA violations. Three types of alerts are available:
- Down Alerts: Triggered when no replies are received within the configured threshold.
- Delay Alerts: Activated when latency exceeds the high threshold and deactivated when it falls below the low threshold.
- Loss Alerts: Sent when packet loss crosses the upper limit and cleared when it drops below the lower limit. These alerts are sent to CESOC and to the email addresses configured per profile. Alerts are grouped to prevent flooding and can be configured to repeat at specific intervals (default every 5 minutes, up to 10 times).
Step 5: Accessing Reports and Logs
Reports are profile-based and accessible directly from the interface. They display the SLA metrics over time and help administrators track trends or recurring issues. - Data is stored for 90 days. - A daily cleanup job ensures older data is purged. - Alerts are stored in JSON format at: /var/crystaleye/network_diagnostic_tool/sdwan_alerts.json. - Application logs are maintained in /var/log/sd-wan-monitor.log with rotation and compression enabled.
Security and Compliance Considerations
The application aligns with Red Piranha’s Secure Software Development and Acquisition Lifecycle (SSDAL) standards. It incorporates: - Role-based access control (Admin/root access only). - Secure data retention policies. - Logging for all SLA violations and administrative actions. - High Availability support via configuration sync between primary and secondary CE units.
Crystal Eye’s SD-WAN Monitoring is not just a diagnostic utility; it is a proactive SLA assurance platform. By providing deep visibility into VPN health, automated alerting, and integrated reporting, this application enables IT and network teams to reduce downtime, ensure compliance, and maintain seamless business operations.
Ping
The Ping feature of the Network Diagnostic Tool app analyses a remote host and checks whether it’s responding and alive to ICMP packets. The feature is basic, and also includes the functionality that allows the administrator to determine and control the number of set packets set while pinging.
Note
Ping in itself is a Linux command. However, an administrator can run a ping command with the help of Ping functionality directly from the graphic user interface of the Crystal Eye XDR.
How to Use Ping Feature of Network Diagnostic Tool?
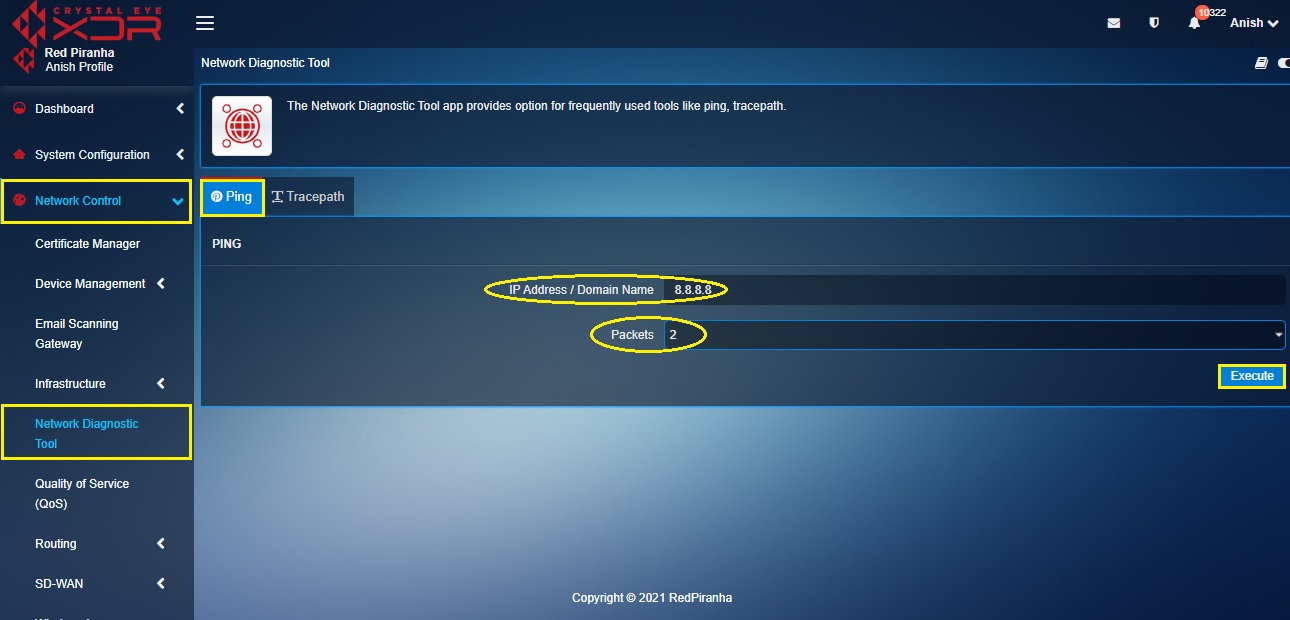
Step 1: In the Ping section, enter the IP address or the Domain Name of the remote host in the IP Address/Domain Name text box, select the Number of Response Packets required from the dropdown and click the Execute button.
Note
The administrator can select the number of response packets to be 1, 2, 3, 4, 5
Tracepath
The Tracepath functionality of the Network Diagnostic Tool app is used by CE XDR administrators to trace the journey of a data that it undertakes to reach the designated destination. This functionality can be used to detect various servers through which the data packet passes and shows each hop in the network. Tracepath scan details can be analysed to identify slow points that affect the network connection and speed in a negative manner.
Note
Tracepath is fundamentally a Linux command. However, an administrator can run a Tracepath command with the help of the Tracepath functionality directly from the graphic user interface of the Crystal Eye XDR.
How to Use the Tracepath Feature of the Network Diagnostic Tool?
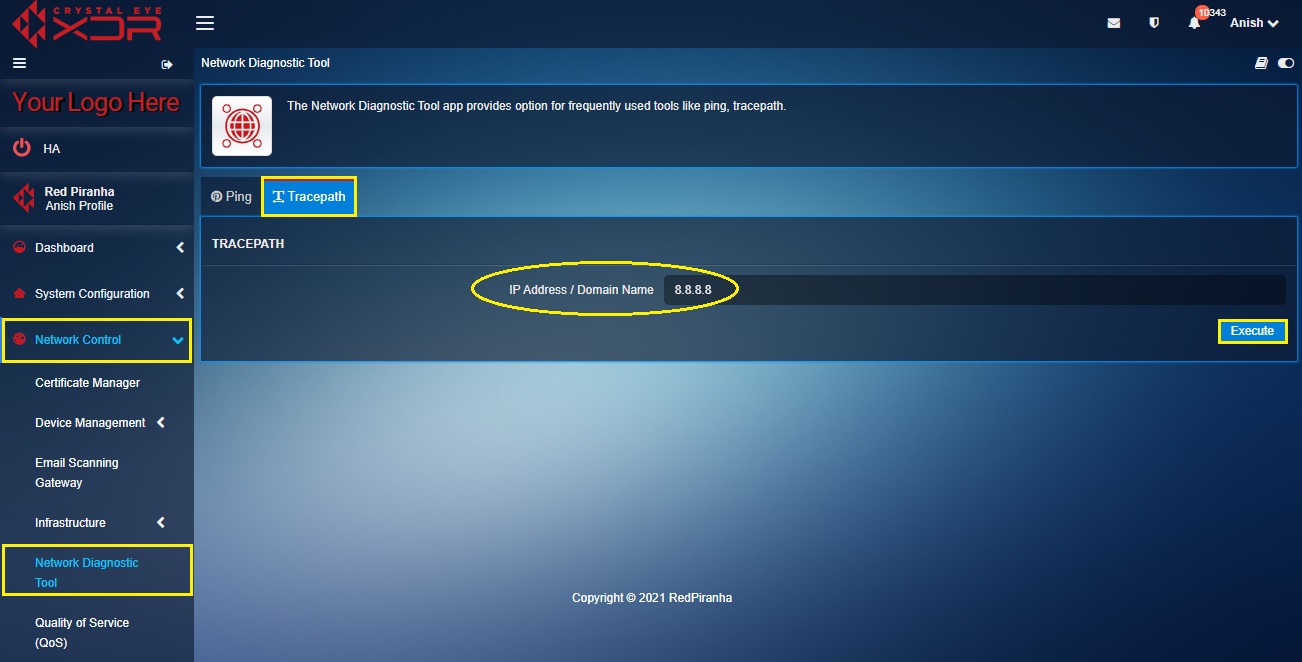
Step 1: In the Network Diagnostic Tool app page, click the Tracepath tab.
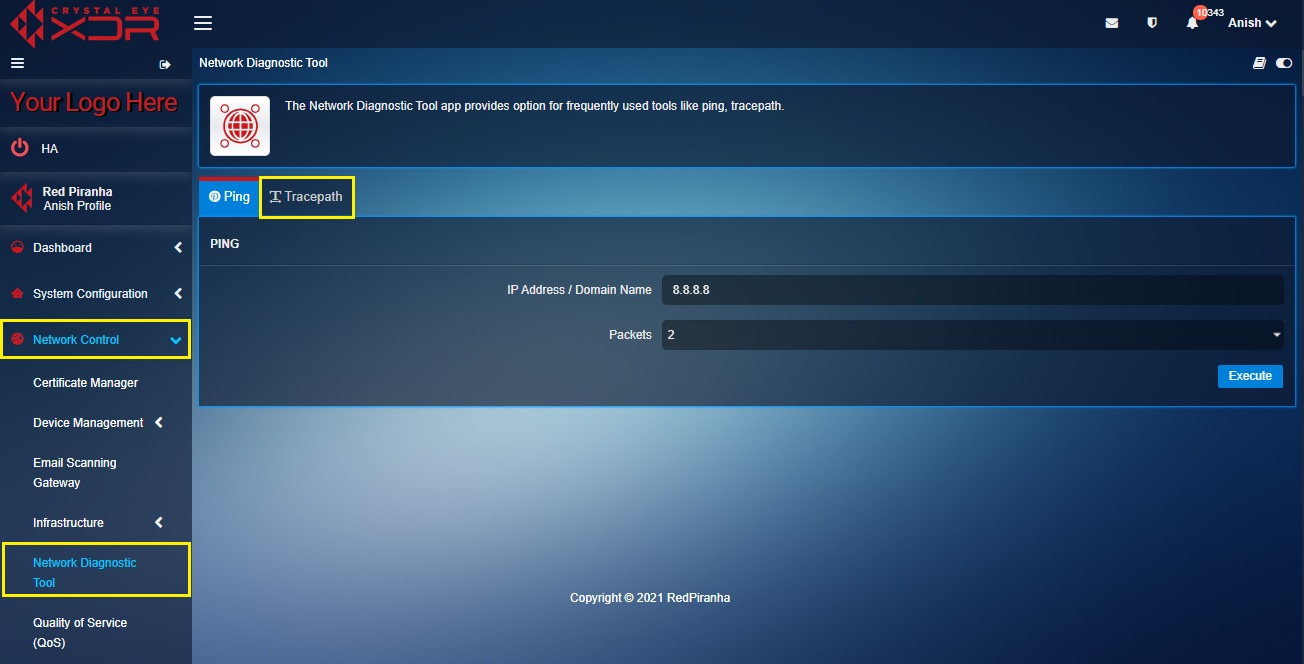
Step 2: You will see the Tracepath page. Enter the destination IP or the Domain Name in the textbox and click the Execute button.