Defender for Endpoint
Overview
Defender for Endpoint stands as a comprehensive and sophisticated endpoint security solution deeply embedded in the Crystal Eye XDR network. This advanced platform goes beyond traditional antivirus measures, offering real-time protection against an array of threats, including viruses and ransomware. Leveraging continuous updates and state-of-the-art threat intelligence, Defender for Endpoint remains vigilant, actively scanning, and promptly neutralizing potential risks to ensure a secure computing environment.
Tailored for corporate networks, this solution becomes a linchpin in cybersecurity strategies, providing robust protection for endpoints. Its user-friendly interface and seamless integration with Microsoft 365 systems facilitate ease of use, making it an indispensable tool for organizations seeking to fortify their digital defences against the ever-evolving landscape of cyber threats. Defender for Endpoint stands as a stalwart guardian, embodying Red Piranhas commitment to ensuring the security and integrity of endpoint devices.
Installation
The Defender for Endpoint application is not available by default. It can be installed from Marketplace in the left-hand navigation panel. After that, make sure to configure and register the API permissions properly.
Configuring Entra ID Enterprise Application
Create application in Entra ID
Sign in to your Entra Admin Center as a global administrator or Application Administrator.
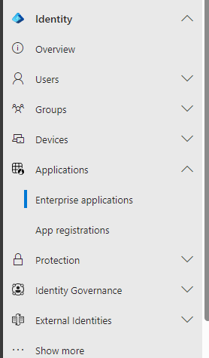
Under Applications click Enterprise Applications
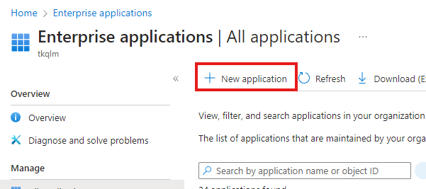
Under Enterprise Application, click New Application
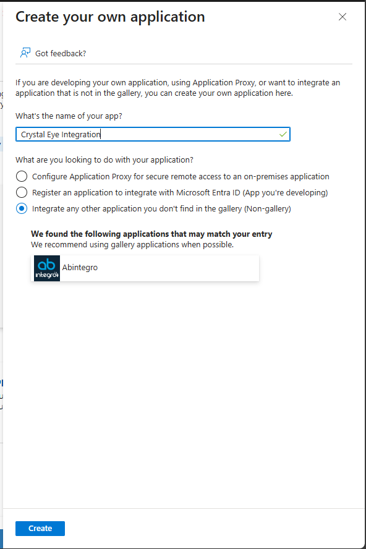
You Will then need to create a Non-Gallery application.
Name and Create Application
Give a name related to the app you’re creating and hit Create. (Note: You will need sufficient permissions to create enterprise application)
Configure & Register API Permissions
Add API permissions to application
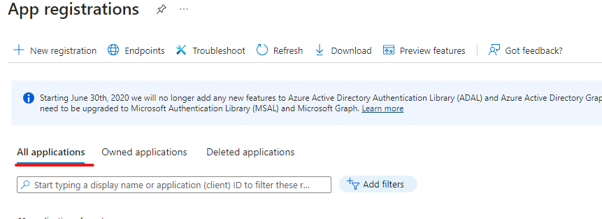
- On the admin blade select "App registration", all applications and search for the application you have just created as below:
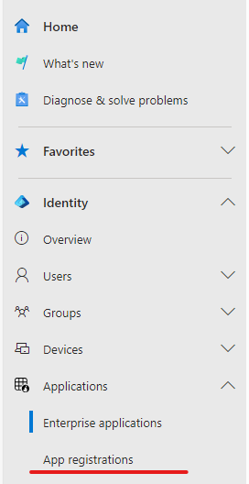
- Open the application and select "API permission" from the blade as below:
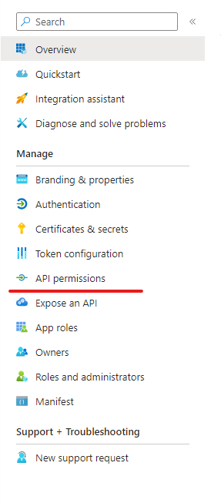
- Click Add permission

- Add the following API permissions
WindowsDefenderATP
| Permission | Type | Description | Admin Consent Required |
|---|---|---|---|
| Alert.Read.All | Application | Read all alerts | Yes |
Microsoft Graph
| Permission | Type | Description | Admin Consent Required |
|---|---|---|---|
| Application.Read.All | Application | Read All Applications | Yes |
| CrossTenantInformation.ReadBasic.All | Application | Read basic cross-tenant access settings | Yes |
| Directory.Read.All | Application | Read directory data (users, groups, devices, etc.) | Yes |
| EntitlementManagement.ReadWrite.All | Application | Manage entitlement management resources | Yes |
| Group.ReadWrite.All | Application | Create and Manage All Groups | Yes |
| GroupMember.ReadWrite.All | Application | Add and remove group members for all groups | Yes |
| Policy.Read.All | Application | Read all policies in the tenant | Yes |
| Policy.ReadWrite.ConditionalAccess | Application | Create and manage Conditional Access policies | Yes |
| Policy.ReadWrite.SecurityDefaults | Application | Manage Security Defaults configuration | Yes |
| User.ReadWrite.All | Application | Create, read, update, and delete any user | Yes |
Office 365 Management APIs
| Permission | Type | Description | Admin Consent Required |
|---|---|---|---|
| ActivityFeed.Read | Application | Read tenant audit log activity | Yes |
| ActivityFeed.ReadDlp | Application | Read DLP-related audit log activity | Yes |
| ServiceHealth.Read | Application | Read Office 365 service health and messages | Yes |
Once the API Permission is added click Grant admin consent for [Your Tenant]
Create New Client Secret
- In App registrations Click Certificates & Secrets.
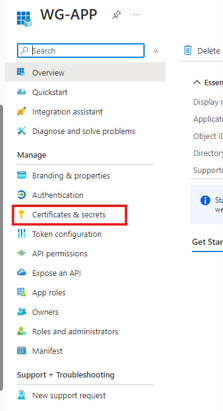
- Then click New Client Secret.
- Enter a Description related to the App and select an Expiration.
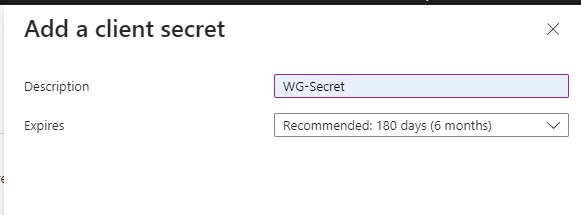
Note: It’s recommended to set the Expiry to 6 months, and client Secret rotation will need to be work into your maintenance routine.
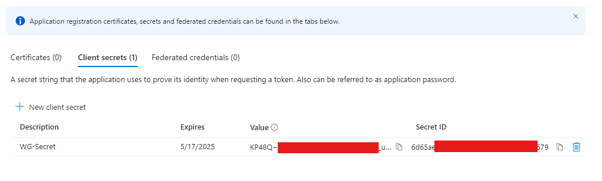
Important: Keep this page open as the Value will need to be copied into the Crystal Eye. Clicking off this page in Entra ID will make it impossible to view the Secret ID again and another will need to be created.
Configuring M365 Risk and Compliance Crystal Eye
Copy Enterprise App Information
- In Entra ID > App Registrations > Your Application > Overview Copy the Tenant ID, Application (client) ID, and Client Secret Value from the previous step.
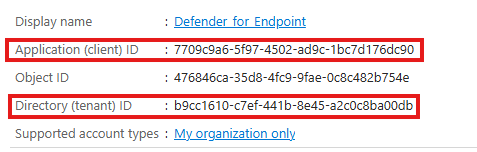
- In the Crystal Eye navigate to Compliance Controls > Microsoft M365 > M365 Risk and Compliance and click on the configuration tab an click the Add + button.
- Paste the application id, tenant id, and client secret in the below fields.
- Once you have given a name and description click add.

- Once you have given a name and description click add.
- Once the tenant app info has been added, you can toggle on defender for endpoint.

Navigation to the Defender for Endpoint Application
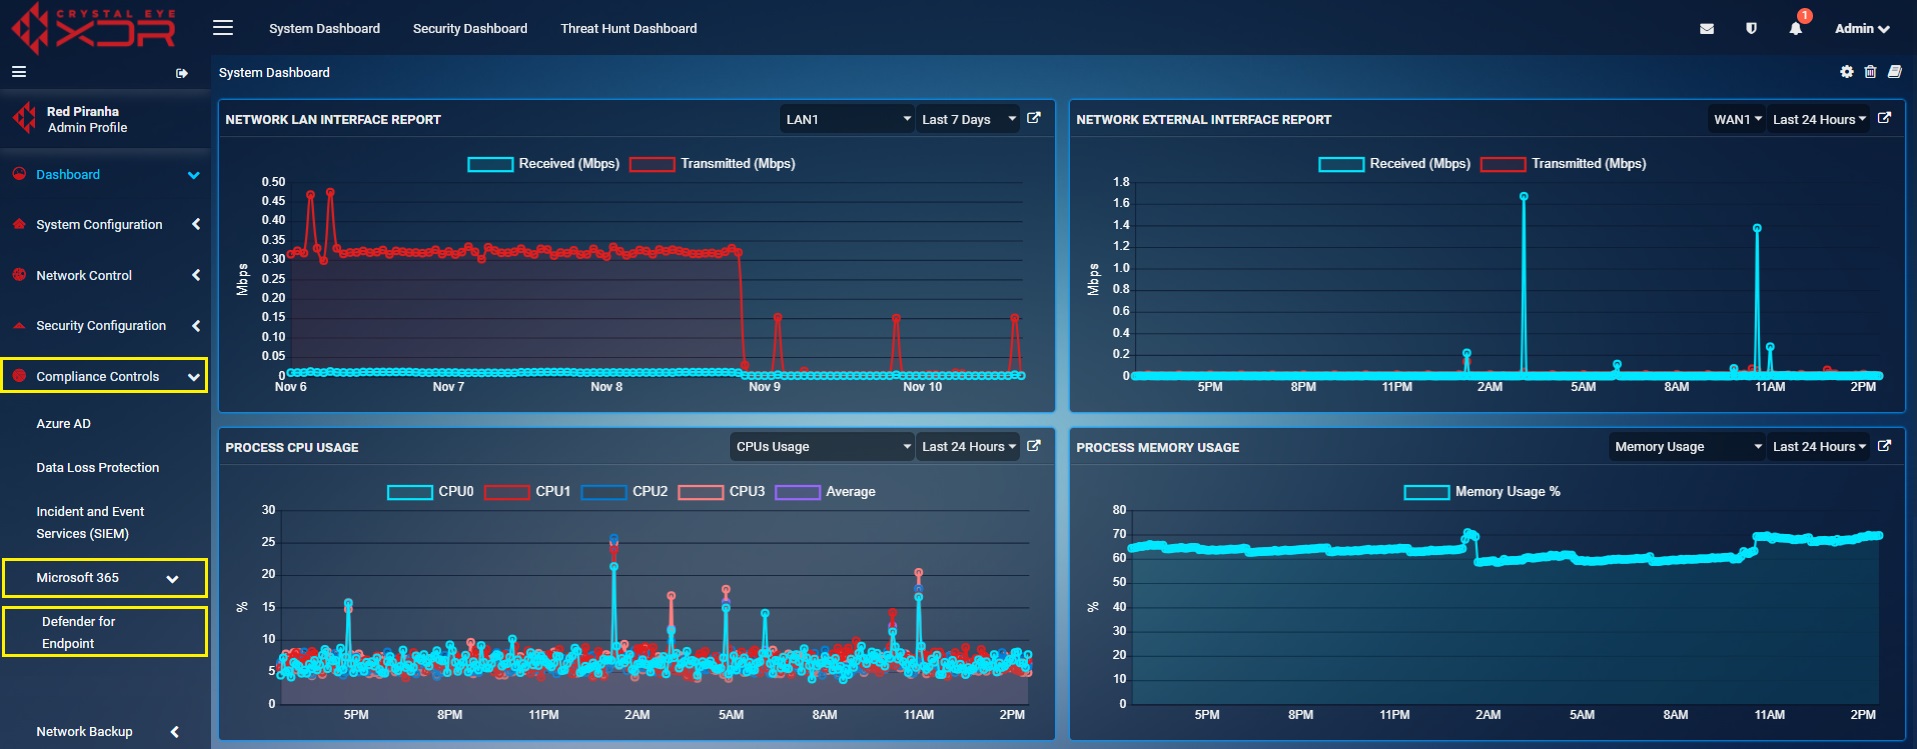
Go to Compliance Controls > Microsoft 365 > Defender for Endpoint
1. Using the Incidents Tab
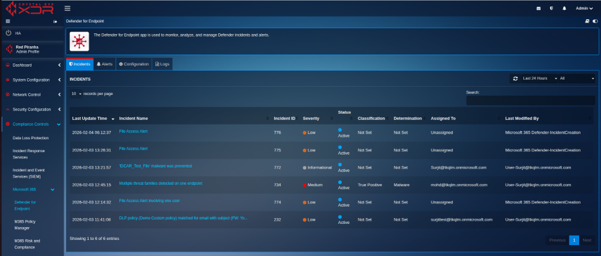
The Incidents tab is the default view when you open Defender for Endpoint in Crystal Eye. This tab displays correlated security incidents that provide a comprehensive view of attack campaigns affecting your organization.
Incidents List View
The Incidents list displays the following columns:
| Column | Description |
|---|---|
| Last Update Time | Timestamp when the incident was last modified (YYYY-MM-DD HH:MM:SS format) |
| Incident Name | Descriptive name of the incident (e.g., "Multi-stage ransomware attack detected") |
| Incident ID | Unique identifier assigned by Microsoft Defender |
| Severity | Incident severity rating: Informational, Low, Medium, High, or Critical |
| Status | Current incident status: Active, Resolved, In Progress, or Redirected |
| Classification | Attack classification: True Positive, False Positive, Benign Positive, or Unknown |
| Determination | Specific |
Use the Refresh button at the top of the incidents list to fetch the latest incident data from Microsoft Defender.
Viewing Incident Details
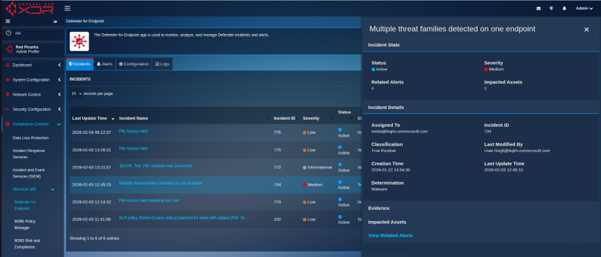
Click on any incident row to open the detailed incident view. The detailed view is organized into the following sections:
Incident State
Displays key metrics about the incident: - Status (Active, Resolved, In Progress, Redirected) - Severity (Informational, Low, Medium, High, Critical) - Number of related alerts - Number of impacted assets In short, it opens a side panel showing everything tied to a selected incident, including status, severity, ownership, evidence, and impacted assets. It also lets you jump to the related alerts for deeper investigation.
Incident Details
Shows comprehensive information about the incident: - Assigned To - Incident ID - Classification (True Positive, False Positive, Benign Positive, Unknown) - Last Modified By - Creation Time - Last Update Time - Determination (Malware, Phishing, Security Testing, etc.)
Evidence
Lists forensic evidence collected during the incident investigation: - Evidence Name (e.g., file name, registry key, process) - Remediation Status (e.g., Prevented, Quarantined, Removed) - Verdict (Malicious, Suspicious, Clean, Unknown)
Impacted Assets
Shows all devices, users, and mailboxes affected by the incident: - For Users: - User Principal Name - User SID - For Mailboxes: - Mailbox Name - Verdict - For Devices: - Device Name - Risk Level - Operating System/Platform
Viewing Related Alerts
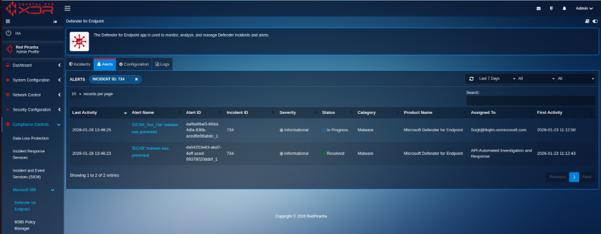
To see all raw alerts associated with an incident, click the "View Related Alerts" button in the incident detail view. This will navigate you to the Alerts tab with an automatic filter applied to show only alerts belonging to that incident.
Filtering Incidents
The Incidents tab provides powerful filtering capabilities to help you focus on specific threats:
| Filter Type | Description |
|---|---|
| Severity | Filter by Informational, Low, Medium, High, or Critical severity levels |
| Status | Filter by Active, Resolved, In Progress, or Redirected status |
| Category | Filter by attack category (e.g., Credential Access, Defense Evasion, Malware, Ransomware) |
| Date Range | Filter by specific date and time range (e.g., 2026-01-20 23:01 to 2026-01-21 00:15) |
| Asset | Filter by specific user or device affected by the incident |
| Parent Incident | Filter by parent incident ID to see related sub-incidents |
Important: Filters applied in the Incidents tab are independent from filters in the Alerts tab. Each tab maintains its own filter state.
2. Using the Alerts Tab
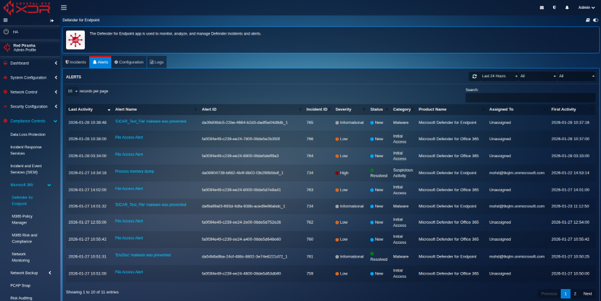
The Alerts tab displays raw, individual security detections generated directly by Microsoft Defender for Endpoint sensors. This view is essential for detailed forensic analysis and investigation of specific security events.
Alerts List View
The Alerts list displays the following columns:
| Column | Description |
|---|---|
| Alert ID | Unique identifier for the alert (new in this version) |
| Alert Name | Descriptive name of the security event (previously called "Title") |
| Severity | Alert severity: Informational, Low, Medium, High, or Critical |
| Category | Attack category based on the MITRE ATT&CK framework (e.g., Credential Access, Defense Evasion, Malware) |
| Product Name | Microsoft Defender product that generated the alert (new in this version) |
| Assigned To | Security analyst assigned to investigate this alert (new in this version) |
| First Activity | Timestamp when the suspicious activity first occurred (new in this version) |
| Status | Alert status: New, In Progress, or Resolved |
Use the Refresh button at the top of the alerts list to fetch the latest alert data from Microsoft Defender.
Viewing Alert Details
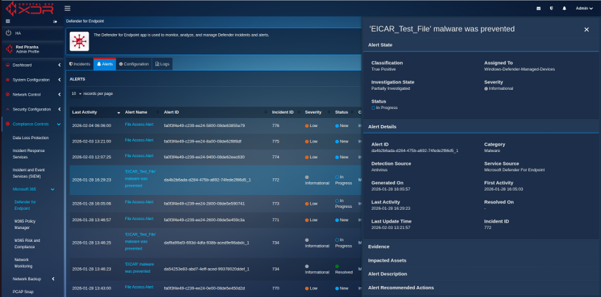
Click on any alert row to open the detailed alert view. The detailed view is organized into the following sections:
Alert State
Displays key information about the alert status: - Classification (True Positive, False Positive, Benign Positive, Unknown) - Assigned To - Investigation State (e.g., Terminated by System, Unsupported Alert Type, Successfully Remediated) - Severity - Status
Alert Details Shows comprehensive technical information: - Alert ID - Category - Detection Source (e.g., Endpoint Detection & Response, Antivirus) - Service Source - Generated On (timestamp) - First Activity (timestamp) - Last Activity (timestamp) - Resolved On (timestamp if resolved) - Last Update Time - Incident ID (links this alert to its parent incident)
Evidence
Lists forensic artifacts associated with this alert: - Evidence Name - Remediation Status - Verdict
Impacted Assets
Shows devices, users, and mailboxes affected by this alert (same format as incident impacted assets).
Alert Description
Detailed explanation of the security event, including context about the detected behavior and potential threat.
Alert Recommended Actions
Microsoft Defender's suggested remediation steps and response actions for this alert.
Filtering Alerts
The Alerts tab provides filtering capabilities to help you focus on specific detections:
| Filter Type | Description |
|---|---|
| Severity | Filter by Informational, Low, Medium, High, or Critical severity levels |
| Status | Filter by New, In Progress, or Resolved status |
| Category | Filter by attack category (e.g., Credential Access, Malware, Ransomware) |
| Incident ID | Filter alerts by their parent incident ID to see all alerts in a specific incident |
| Date Range | Filter by specific date and time range (e.g., 2026-01-20 23:01 to 2026-01-21 00:15) |
| Asset | Filter by specific user or device affected by the alert |
Important: Filters applied in the Alerts tab are independent from filters in the Incidents tab. Each tab maintains its own filter state.
3. Using Configuration Tab
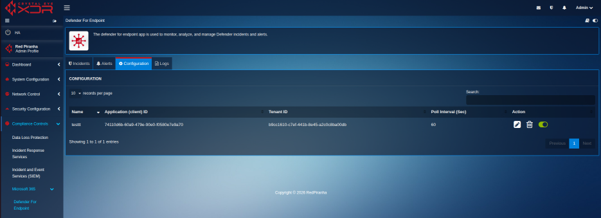
This page shows configured tenant details. This tab has option to ad/update/delete tenant info.
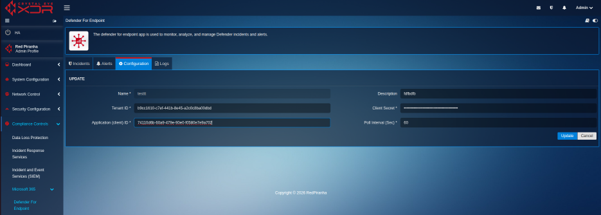
To update the configuration, Click the Edit button to open the Configuration Update Form, which allows you to modify tenant connection settings.
This form is used to add or update tenant details required for integration with the Entra Defender App. It includes the configuration name (mandatory and locked), description, Tenant ID, Application (Client) ID, Client Secret, and Poll Interval in seconds, all of which are required fields for successful data ingestion.
This have following Fields:
- Name: Name of the configuration. This field is mandatory and not editable.
- Description: Description of the configuration.
- Tenant ID: Microsoft Entra Tenant ID. This is a mandatory field.
- Client Secret: Client secret of the Microsoft Entra registered application. This is a mandatory field.
- Application (Client) ID: Application (Client) ID of the Microsoft Entra registered app. This is a mandatory field.
- Poll Interval (Seconds): Ingestion polling interval that defines how frequently the ingester calls Microsoft Entra / Graph APIs to fetch data. This is a mandatory field.
4. Using Logs Tab
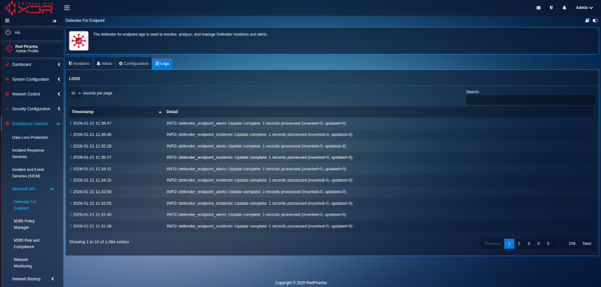
The Logs tab provides visibility into the Defender for Endpoint ingester service operations. This is essential for operational monitoring, troubleshooting connection issues, and verifying that data is being properly synchronized from Microsoft Defender.
What Are Ingester Logs?
Ingester logs record all activities related to the automated polling and synchronization process that fetches incidents and alerts from Microsoft Defender APIs. These logs help you:
- Verify that API connections are working correctly
- Monitor the polling interval and data retrieval frequency
- Identify authentication or permission errors
- Track when incidents and alerts were last synchronized
- Troubleshoot issues with missing or delayed security data
Accessing Ingester Logs
Navigate to the API Logs tab in Defender for Endpoint. The logs are displayed in chronological order with the most recent entries at the top.
Log Entry Information
Each log entry typically contains:
- Timestamp: When the log entry was created
- Log Level: Severity (INFO, WARNING, ERROR)
- Component: Which part of the system generated the log (e.g., API Client, Polling Service)
- Message: Description of the event or error
- Details: Additional technical information (API endpoints, response codes, etc.)
Common Log Messages
| Log Message | Meaning |
|---|---|
| Successfully authenticated to Microsoft Graph API | Connection to Microsoft Defender is working properly |
| Fetched X incidents, Y alerts | Normal polling operation completed successfully |
| Authentication failed - invalid client secret | Client secret has expired or is incorrect and needs to be updated in configuration |
| API permission denied - SecurityIncident.Read.All required | API permissions are not properly configured in Entra ID |
| Rate limit exceeded - retrying in X seconds | API throttling. The service will automatically retry |
| Connection timeout to graph.microsoft.com | Network connectivity issue or Microsoft service outage |
Note: If you see persistent errors in the ingester logs, contact Red Piranha support.
Navigation Guide
Understanding how to navigate between incidents and alerts is key to efficient security investigation. This section explains common workflows.
Workflow 1: From Incident to Related Alerts
Use Case: You want to investigate the individual alerts that make up a specific incident.
- Navigate to the Incidents tab
- Click on an incident to open its detail view
- Click the "View Related Alerts" button
- The Alerts tab will open with a filter automatically applied showing only alerts from that incident
Workflow 2: From Alert to Parent Incident
Use Case: You're investigating an alert and want to see the broader attack context.
- Navigate to the Alerts tab
- Click on an alert to open its detail view
- Note the Incident ID shown in the Alert Details section
- Navigate to the Incidents tab
- Use the filter to search for that Incident ID
Workflow 3: Investigating by Asset
Use Case: You want to see all security events (incidents and alerts) affecting a specific user or device.
- Navigate to the Incidents tab
- Apply the Asset filter with the user or device name
- Review incidents affecting that asset
- Navigate to the Alerts tab
- Apply the same Asset filter
- Review all raw alerts for that asset
Tip: Remember that filters are independent between tabs. If you apply a filter in Incidents and then switch to Alerts, you'll need to reapply your filter criteria in the Alerts tab.
Field Definitions
This section provides detailed definitions for all fields used in Defender for Endpoint incidents and alerts.
Incident Fields
| Field Name | Definition |
|---|---|
| Incident ID | Unique identifier assigned by Microsoft Defender for this incident. Used to correlate alerts and track the incident lifecycle. |
| Classification | Overall assessment of the incident. Values: True Positive (confirmed threat), False Positive (benign activity misidentified as threat), Benign Positive (unusual but legitimate activity), Unknown (investigation pending). |
| Determination | Specific type of threat or activity detected. Examples: Malware, Phishing, Security Testing, Unwanted Software, Line-of-Business Application, Compromised Account, Malicious User Activity, Clean, Not Malicious. |
| Assigned To | Email address or username of the security analyst or automated system assigned to investigate and resolve this incident. |
| Last Modified By | Email address or username of the person who last updated any aspect of the incident (status, classification, comments, etc.). |
| Related Alerts Count | The total number of individual alerts that have been correlated into this incident. Higher counts may indicate more complex or widespread attacks. |
| Impacted Assets Count | The total number of devices, users, and mailboxes affected by this incident. Used to assess the scope and potential impact of the attack. |
Alert Fields
| Field Name | Definition |
|---|---|
| Alert ID | Unique identifier for this specific alert detection. Used for tracking and correlation. |
| Product Name | The Microsoft Defender product that generated this alert (e.g., Microsoft Defender for Endpoint, Microsoft Defender for Office 365, Microsoft Defender for Identity). |
| Detection Source | The specific detection mechanism that triggered the alert. Examples: Antivirus, EDR (Endpoint Detection and Response), Behavioral Analysis, Cloud App Security, Custom Detection Rule. |
| First Activity | Timestamp when the suspicious or malicious activity first occurred on the endpoint. This may be earlier than when the alert was generated, as detection can occur after the initial activity. |
| Investigation State | Current state of the automated or manual investigation. Examples: Terminated by System, Unsupported Alert Type, Successfully Remediated, Partially Remediated, Running, Pending Resource, Waiting for User Action. |
| Incident ID | The unique identifier of the parent incident to which this alert belongs. Use this to navigate from an alert to its broader attack context. |
Evidence Fields
| Field Name | Definition |
|---|---|
| Evidence Name | The name or identifier of the forensic artifact. Examples: file name (malware.exe), process name (powershell.exe), registry key, network connection, email subject line. |
| Remediation Status | Action taken on the evidence. Examples: Prevented (blocked before execution), Quarantined (isolated from system), Removed (deleted), Remediated (neutralized), None (no action taken), Pending (action in progress). |
| Verdict | Security assessment of the evidence. Values: Malicious (confirmed threat), Suspicious (potentially harmful), Clean (benign), Unknown (analysis pending or inconclusive). |
Impacted Asset Fields
| Field Name | Definition |
|---|---|
| User Principal Name | The email-style identifier for a user account (e.g., [email protected]). Used in Active Directory and Azure AD environments. |
| User SID | Security Identifier. A unique alphanumeric string assigned to each user account in Windows environments. Remains constant even if the username changes. |
| Device Name | The hostname or computer name of the affected endpoint (e.g., LAPTOP-ABC123, SERVER-PROD-01). |
| Risk Level | Overall risk assessment for the device based on detected threats and security posture. Values: None, Low, Medium, High, Severe. |
| OS/Platform | Operating system and version running on the device (e.g., Windows 11 22H2, Windows Server 2019, macOS 14.1, Linux). |
| Mailbox Name | Email address of the mailbox involved in the incident (relevant for email-based threats like phishing). |
Status and Severity Values
Incident/Alert Status:
| Status | Meaning |
|---|---|
| New | Alert/Incident has been detected but not yet reviewed by an analyst. |
| Active | Incident is ongoing and requires immediate attention. |
| In Progress | Investigation and remediation are underway. |
| Resolved | Incident/Alert has been addressed and closed. |
| Redirected | Incident has been reassigned to another team or system for handling. |
Severity Levels:
| Severity | Response Priority |
|---|---|
| Informational | No immediate action required. For awareness and context only. |
| Low | Minor threat with limited potential impact. Review within 24-48 hours. |
| Medium | Moderate threat that should be investigated within business hours. |
| High | Significant threat requiring prompt investigation and response within hours. |
| Critical | Severe threat with potential for major damage. Requires immediate attention and escalation. |