Introduction to Orchestrate
The Orchestrate platform is part of the Crystal Eye XDR ecosystem allowing Red Piranha Partners to monitor real time CE XDR metrics of multiple deployments of their clients from a centralized platform.
The Orchestrate dashboard unifies security operations ensuring a centralized approach while dealing with organizational threats. This is made possible with the orchestrate platform’s ability to collect data from multiple Crystal Eye XDRs deployed across the organization. The data collected from these deployments are visualized in dynamic Orchestrate dashboards providing security analysts and risk advisors greater network visibility and an opportunity to decrease the mean time to respond to threats.
The Orchestrate platform also facilitates security automation providing the required leverage to SOC teams and teams acting at a risk advisory level to detect, respond and treat organizational threats through a centralized platform.
Navigation to the Orchestrate Dashboard Account
Go to https://store.redpiranha.net/ and log in using your Orchestrate dashboard credentials.

Important Concepts—Partner Orchestrate Account
The partner orchestrate account can be used to monitor and manage multiple client CE XDRs.
The following are some CE XDR related functions that can be performed with the help of the Partner orchestrate Account:
Monitor multiple CE XDR deployments of Your Clients through Dynamic Dashboards
- Know total Number of CE XDR Deployments
- Know total Number of active Licenses of the CE XDR Deployment
- Know the Number of expired Licenses of the CE XDR Deployment
- Know total Number of CE XDR Licenses due to expire in 30 days
- Know total Number of Application Issues in all CE XDR deployments
- Know total Number of Offline Devices
- Detect SIEM Disconnections Across all CE XDR deployments
Monitor a Single CE XDR Deployment of your Client through Dynamic Dashboards
- Know the hostname of the CE XDR deployment
- Know the Host key of the CE XDR deployment
- Know the software version of the CE XDR deployment
- Know the SIEM Level of the CE XDR Deployment
- Know the License Expiry Date of the CE XDR Deployment
- Know the Application Status of the CE XDR Deployment
- Know the System Status of the CE XDR Deployment (RAM Usage & CPU Usage)
View the Reports Repository of your client triggered from the CE XDR deployment
- View the PCAP Analysis Report triggered from a CE XDR Deployment
- View the Vulnerability Scan Report
- View Scheduled Date & Time of the PCAP Analysis
- View Scheduled Date & Time of the Vulnerability Scan
- View the Reports Triggered from the CE XDR
- Accessing the CE XDR User Interface of your Client from the Orchestrate Dashboard
Order Integrated CE XDR services for Clients
Partner’s Orchestrate accounts can also be used to order integrated CE XDR services for their clients. These integrated CE XDR services include:
-
Backup: Backup escalations are done to ensure backup of network and forensic files
-
Digital Forensics: Order Digital Forensic escalations are done in an event of security breach
-
eCISO: Electronic CISO services can be ordered by the partners on behalf of their clients. The eCISO services helps organizations improve their security posture (CE XDR deployment is required for eCISO services)
-
Incident Response: This capability allows clients to respond to incidents in a structured manner in an event of a security breach.
-
Threat Hunting & PCAP Services: This escalation is done by through the partners account to opt order threat hunting and packet capture / analysis services for a client.
-
Vulnerability Scanning: Partner accounts have the capability to Initiate integrated vulnerability scans to understand the client’s security posture and exposure. (CE XDR deployment is required for Vulnerability Scanning Services)
Order CE XDR Products for Clients
Partner’s Orchestrate accounts can also be used to order CE XDR Products for their clients. These CE XDR products include:
- Crystal Eye 360 Bundles: The partner’s orchestrate account offers the capability to order 360 bundles with Crystal Eye appliances, support and eCISO.
- Crystal Eye XDR Cloud: The partners orchestrate can be used to order the Crystal Eye XDR cloud offering for the client.
Refer & Earn
The Refer & Earn module in the Partner Orchestrate Account allows Red Piranha partners to send invites to potential clients to create an Orchestrate account. The My Commission Module states the commissions earned on the sale of CE XDR products and services.
Important Concepts—Self Managed Orchestrate Account
Self-managed Orchestrate accounts allows its users to perform and monitor a list of Crystal Eye XDR related functions. This account type allows multiple CE XDR deployments to be monitored from a single platform. It also allows to view the report repository of all these CE XDR deployments, purchase CE XDR integrated services and standalone services.
Monitor your CE XDR Deployment through Dynamic Dashboards
- View all deployments in a tabular format (Know the Location, Model Number, Hostname, SIEM License Expiry, Alerts, Current Schedules)
- Archive a CE XDR Deployment
- Purchase a CE XDR integrated service aligned to a particular CE XDR deployment
- Search for a CE XDR Deployment
- Know the hostname of the CE XDR deployment
- Know the Host key of the CE XDR deployment
- Know the software version of the CE XDR deployment
- Know the SIEM Level of the CE XDR Deployment
- Know the License Expiry Date of the CE XDR Deployment
- Know the Application Status of the CE XDR Deployment
- Know the System Status of the CE XDR Deployment (RAM Usage & CPU Usage)
Report Repository
- View the PCAP Analysis Report triggered from a CE XDR Deployment
- View the Vulnerability Scan Report
- View Scheduled Date & Time of the PCAP Analysis
- View Scheduled Date & Time of the Vulnerability Scan
Purchase CE XDR Integrated Services such as
Backup, Digital Forensics, ECISO Incident Response, Threat Hunting & PCAP Services, and Vulnerability Scanning
Purchase standalone services such as
Consulting services: Book security consulting services with our team of security professionals
Digital Forensics: Order Digital Forensic services if you’ve experienced a security breach
Incident Response: Order Incident Response capability if you’ve experienced a security breach
Network Engineering Services: Order Network Engineering services to assist with deployments
Security Training: Keep staff up-to-date on the latest security threats and company policies
vCISO: Order the virtual CISO service to help develop your security program
VPN: Order a stand-alone secure Virtual Private Network
Vulnerability Assessment & Penetration Testing: Order VAPT services to understand your security posture and exposure
Important Concepts—Partner Orchestrate Account Vs Self-Managed Orchestrate Account
The following table will help in distinguishing MSP/MSSP Orchestrate account from an end-client Orchestrate account:
| Orchestrate Features | Red Piranha Partner Orchestrate Account | End-client Orchestrate Account |
|---|---|---|
| Monitor multiple CE XDR deployments of the end-clients | Yes | No |
| Monitor self-owned CE XDR deployments | Yes | Yes |
| Add staff members and external team members | Yes | Yes |
| Monitor Active & expired licenses of end-clients CE XDR deployments | Yes | No |
| Monitor Active & expired licenses of self-owned CE XDR deployments | Yes | Yes |
| Assign roles to staff members and external team members | Yes | Yes |
| Order Crystal Eye XDR product | Yes | Yes |
| Order CE XDR integrated services | Yes | Yes |
| Order Stand-alone services | Yes | Yes |
| Order Managed services | Yes | Yes |
| View Agreements | Yes | Yes |
| Online referral & earn system | Yes | No |
| Shipment Tracking System | Yes | Yes |
| Training Portal | Yes | Yes |
Orchestrate Account Security Management—Security Goals
Red Piranha’s Orchestrate platform offers the ability to assign roles-based access control for your staff member and external team members. Access can be granted to specific modules of the orchestrate account based on roles such as billing authority, technical manager, security manager and training.
Note
If you are an MSSP you will have the ability to assign your staff member to access an end-client’s account. Such a scenario would require the end-client to allow access.
3 Security goals achieved through Orchestrate platform’s in-built security model:
- Level of access provided to users based on organizational structure and policies
- Data sharing for organizational collaboration keeping in mind team boundaries
- Data partitioned to the extent that it prevents users from accessing data that they are not meant to access.
Orchestrate Account Security Management—Multifactor Authentication
The Orchestrate dashboard has an in-built multi-factor authentication mechanism that can be enforced as a second layer of security during account log in.
Two-factor authentication is the best way to keep your account secure. It is optional but highly recommended security feature that adds an extra layer of penetration to your Red Piranha Orchestrate account.
Once enabled, you will be required to enter a six-digit security code in addition to your password whenever you sign in to the Orchestrate account.
How to activate multi-factor authentication for your Orchestrate dashboard account?
Step 1: Click your account email address on the top right corner of your Orchestrate dashboard page. You will see a dropdown pop-up. Click 2-factor authentication.

Step 2: You will now be prompted to choose the authentication method. Select Google Authenticator from the dropdown and click the Update button.

Step 3: Install the Google Authenticator App
Go to your mobile device app store and install the Google Authenticator app on your mobile device.
Step 4: Add your Red Piranha Orchestrate account to Google Authenticator
Open Google Authenticator and add your Red Piranha Orchestrate Account by scanning the QR code or by entering the setup key.
Note
To prevent unauthorized access to your account, we recommend that you do not open the QR code or the setup key in view of other people.
Step 5: Verify that your Red Piranha Client Dashboard Account is properly configured
After adding your Red Piranha Client Dashboard Account to Google Authenticator, provide the 6-digit code generated by the Google Authenticator app to verify that your authentication is working properly.

Orchestrate Account Security Management—IP Address Verification
This authentication feature is optional but highly recommended. It adds an extra layer of protection to your Red Piranha Orchestrate dashboard account.
Note
Before enabling, make sure you have setup the device for your Two-Factor Authentication. In case you need to login from unverified IP Address, you may still be able login securely using the Two-Factor Authentication method.
Once enabled, you will be required to login from the approved IP addresses. You may approve an IP address upon login by following the approval link sent to your email address or manually add IP address by clicking the Add IP Address button below.
How to manually add an approved IP address that can access the Orchestrate dashboard?
Step 1: Click your account email address on the top right corner of your Orchestrate dashboard page. You will see a dropdown pop-up. Click IP Address Verification.

Step 2: You will now see the IP Verification page. Click the Add IP Address button.

Step 3: You will now see the IP Address pop-up. Enter the IP address.

Note
Before enabling, make sure you have setup the device for your Two-Factor Authentication. In case you need to login from unverified IP Address, you may still be able login securely using the Two-Factor Authentication method.
Account Security Management—Change Password and View Activity Logs
Users can change their passwords and view their activity logs. The activity logs show date & time stamp and the associated device IP address which was used while logging into the Orchestrate dashboard.
Note
Click the email address on the top right corner of the page. You will then see a pop-up dropdown with the Change Password & Activity Logs option.
ACL Management in Orchestrate
Red Piranha’s Orchestrate platform offers the ability to assign role-based access control for staff members and external team members. Access can be granted to specific modules of the orchestrate based on roles such as billing authority, technical manager, security manager and training.
The Orchestrate platform has a robust ACL management module built into its user interface which allows MSSPs it’s clients to collaborate and provide cross accounts permissions.
ACL Management in Orchestrate explained with respect to various collaboration stages between a Red Piranha Partner & its client:

Stage 1: In a general use case portraying Red Piranha Partner & Client collaboration, a Red Piranha partner invites an end-client to create an Orchestrate account.
Stage 2: The client creates the Orchestrate account and logs in after which the desired access permissions is provided to the Red Piranha Partner. Completion of this process also ensures that the end-client account is linked to the RP Partner managed account.
Stage 3: Later, the RP Partner assigns role-based access control for its staff members so that they have access to the designated modules of the End-client’s Orchestrate account.
Let’s understand the 3 stages of Red Piranha Partner & Client collaboration in the Orchestrate with the help of the use case below:
The Red Piranha Partner invites its client to create an Orchestrate account.
The End-client in turn provides access to the following Orchestrate modules:
- Billing Authority (Orders, Services, Tracking System, Cart)
- Technical Manager (Agreements, Training, Your Staff)
- Security Manager (Devices, Application Status, System Status, Schedules, Reports, Incident Report)
The Red Piranha Partner provides its staff access to the selective modules of the end-clients Orchestrate account based on their roles.
Let’s configure the Red Piranha partner managed Orchestrate account and a self-managed client Orchestrate account to reflect the above use case.
The Red Piranha Partner uses the Orchestrate platform to invite an end-Client to create an Orchestrate Account
Step 1: Go to My Clients > Overview

Step 2: You will now see the My Clients Overview page. Click the Add Client button.

Step 3: You will now see the Add Client pop-up. Enter the Client Name, Client Email Address and click the Add Client button. In this case we have added the client’s name as Angela Enterprise and the email address as [email protected]

Note
Once the end-client is added as a client in the Red Piranha partner’s account an invite email is sent to the end-client to create an orchestrate account. Refer the screenshot below to see the contents of the automated emails. 
The End-client Allows Full Access or Partial Access to the Red Piranha Partner to various Orchestrate modules (the following steps are to be done in the end-client’s Orchestrate account)
Step 4: Post end-client account creation and log in, go to My Settings > ACL Management.

Step 5: You will now see the Client to Partner ACL interface.
Select the following and click the Update Access button.
- Billing Authority (Orders, Services, Tracking System, Cart)
- Technical Manager (Agreements, Training, Your Staff)
- Security Manager (Devices, Application Status, System Status, Schedules, Reports, Incident Report)

Note
In our scenario we have given full access to the Red Piranha Partner by allowing access to all three categories namely, Billing Authority, Technical Manager and Security Manager. Partial access to these sections can also be given as desired.
Role-based Access Control assigned by the Red Piranha Partner for its staff (the following steps will be pursued in the partner managed Orchestrate account)
Step 6: Go to My Settings > My Staff

Step 7: You will see the Your Staff page. Click the Update Roles to Clients button next to the staff member for which role-based access control needs to be assigned.

Note
In our scenario we will pick a staff member ‘Shiya Thomas’ and assign her the role of a Security Manager. She will have access to Devices, Application Status, System Status, Schedules, Reports, and Incident Report.
Important
You may add an existing staff or a new staff member by just clicking the Add Staff button.
Step 8: You will now see the role-based access control pop-up of the staff member. In our case we have pulled up the details of the staff member ‘Shiya Thomas’. In the screenshot below the MSSP staff Shiya Thomas is given access to monitor Devices, Application Status, System Status, Schedules, Reports, and Incident Report.

My Licences
This section shows the list of Active and Expired licenses of CE XDR Deployments. The screenshot below shows the list of Active CE XDR deployment licenses.

My CE XDR Deployments
This module is designed to help Red Piranha Partners and end-clients to monitor self-owned CE XDR deployments through dynamic dashboards. These dynamic dashboards also provide access to the reports repository which displays the reports and their schedules triggered from the Crystal Eye XDR.
The following reports scheduled from the CE XDR can be viewed in the My CE XDR Deployments section.
- PCAP SNAP Report (Know more about the PCAP SNAP application in the CE XDR which is used the schedule the PCAP SNAP report)
- Vulnerability Scanning Report (Know more about the Vulnerability Scanning application in the CE XDR which is used the schedule the Vulnerability Scan. A report is generated post scan and is auto posted in the Orchestrate)
- CE XDR Executive Report.
Monitor your CE XDR Deployment through Dynamic Dashboards
-
View all deployments in a tabular format (Know the Location, Model Number, Hostname, SIEM License Expiry, Alerts, Current Schedules)
-
Archive a CE XDR Deployment
-
Purchase a CE XDR integrated service aligned to a particular CE XDR deployment
-
Search for a CE XDR Deployment
-
Know the hostname of the CE XDR deployment
-
Know the Host key of the CE XDR deployment
-
Know the software version of the CE XDR deployment
-
Know the SIEM Level of the CE XDR Deployment
-
Know the License Expiry Date of the CE XDR Deployment
-
Know the Application Status of the CE XDR Deployment
-
Know the System Status of the CE XDR Deployment (RAM Usage & CPU Usage)
Report Repository
- View the PCAP Analysis Report triggered from a CE XDR Deployment
- View the Vulnerability Scan Report
- View Scheduled Date & Time of the PCAP Analysis
- View Scheduled Date & Time of the Vulnerability Scan
My Subscriptions
The My Subscription module displays records related to the subscriptions of the products and services purchased in the past.
My Order History
The My Order History module sheds light on the products and services ordered in the past.
Training Module Management
This module is essentially a learning management system built into the core Orchestrate platform. A list of training courses can be opted from the learning hub integrated to the training module of the orchestrate.
The ACL management in Orchestrate allows administrators to offer role-based access to their staff allowing them restricted access to certain modules of the Orchestrate account. This role-based functionality can also be implemented for your staff so that they have access only to the training platform.
How to create accounts of your employees in the Orchestrate and provide access only to the Security Training courses under the training module?
Step 1: Go to My Settings > My Staff

Step 2: You will now see the My Staff page. Click the Add Stuff button.

Step 3: You will now see the Add Staff pop-up. Enter the First Name, Last Name and the Email Address of the staff member and click the Save button.

Note
An email will now be sent to the staff that would prompt them to create an account. Once the account is created the roles of the staff can be assigned to access the security training module.
Step 4: You will now see the email address of the staff in the Your Staff section. Click the Edit Roles button.

Note
The Edit Roles button will be greyed out until the staff creates their respective orchestrate account.
Step 5: You will now see the Edit Roles pop-up. Check the tick box under Training (Training Courses) and click the Update Roles.

Orchestrate Functions for Red Piranha Partners
A Red Piranha Partner Orchestrate account has a variety of dynamic dashboards that can be used for intense network security monitoring of CE XDR clusters deployed in various client sites. A range of CE XDR products, CE XDR integrated services and standalone services can also be ordered from the Partner managed Orchestrate account.
A. Monitor multiple CE XDR deployments of Clients through the My Clients Overview Dashboard
Multiple client CE XDR deployments can be monitored from the My Clients Overview Dashboard. Some of the parameters that can be monitored are mentioned below.
To go to the My Clients overview Dashboard, go to My Clients > Overview
Know total Number of Client accounts Linked to the Partner Managed account

Know the total number of CE XDR deployments of the client

Know total Number of active Licenses of the CE XDR Deployment

Know the Number of Expired Licenses of the CE XDR Deployment

Know total Number of CE XDR Licenses due to expire in 30 days

Know total Number of Application Issues in all CE XDR deployments

Know total Number of Offline Devices

Detect SIEM Disconnections Across all CE XDR deployments

B. Detailed Monitoring of a CE XDR Deployment of your Client through Dynamic Dashboards
A Red Piranha Partner can manage and monitor the CE XDR deployment of a particular client.
To access the CE XDR deployment dashboard of a client, go to:
Step 1: Left-hand Navigation Menu > My Clients > select the Deployment button next to the desired client

Step 2: You will see all the CE XDR deployments of the selected client. Click the View button of the client CE XDR deployment that needs to be monitored.

You will now see a dynamic dashboard of the selected client CE XDR deployment that will help you to monitor the following parameters.
Know the hostname of the client CE XDR deployment

Know the Host key of the client CE XDR deployment

Know the software version of the CE XDR deployment

Know the SIEM Level of the CE XDR Deployment

Know the License Expiry Date of the CE XDR Deployment

Know the Application Status of the CE XDR Deployment

Know the System Status of the CE XDR Deployment (RAM Usage & CPU Usage)
C. Reports Repository of your client triggered from the CE XDR deployment
The reports repository allows Red Piranha Partners to access reports such as PCAP SNAP and Vulnerability Scan Reports that have been triggered from their clients CE XDR deployments.
- View and download the PCAP Analysis Report triggered from a CE XDR Deployment
- View and download the Vulnerability Scan Report
- View Scheduled Date & Time of the PCAP Analysis
- View Scheduled Date & Time of the Vulnerability Scan
- View the Reports Triggered from the CE XDR
- Accessing the CE XDR User Interface of your Client from the Orchestrate Dashboard (Click the manage button as shown in the screenshot below)

D. Ordering CE XDR Integrated Services for your Clients & Linking them to a CE XDR Deployment
A Red Piranha Partner can offer a range of Crystal Eye XDR integrated services to its client. Some of these services are mentioned below:
- Cloud backups of your client’s network and forensic files
- Digital Forensic services if your client has experienced a security breach
- Electronic CISO service to improve your client’s security posture
- Incident Response capability services if your client has experienced a security breach
- Threat hunting and packet capture / analysis services
- Initiate integrated vulnerability scans to understand your client’s security posture and exposure
Orchestrate Dashboard: Risk Report
1. Introduction
Modern organizations rely on countless connected devices, each carrying its own risk profile. Without a centralized system, tracking these risks turns into a guessing game; spreadsheets grow stale, incident details slip through email threads, and no one has a single source of truth to prove that threats are being properly handled. This fragmented approach leaves gaps that attackers love to exploit and auditors love to flag.
The Risk Report module in Orchestrate was built to close that gap. It solves the chaos by automatically pulling live risk data into one dashboard, showing trends, highlighting what needs review, and giving clear advice for mitigation. This means security teams spend less time chasing status updates and more time acting on real priorities. Every action is traceable, every risk is visible, and every device stays accounted for.
This approach also aligns with common security frameworks like ISO 27001 and NIST 800-53, which stress the need for documented risk management, continuous monitoring, and periodic reviews. By centralizing risk tracking and tying it to clear advice and audit-ready records, the Risk Report makes it easier for organizations to show compliance and prove they’re serious about risk reduction; not just in policy but in daily practice.
The Risk Report module in the Orchestrate Dashboard is designed to help you get full visibility into the cybersecurity risks tied to your managed devices. Instead of juggling disconnected reports or static spreadsheets, you get an interactive, always up-to-date view with charts, tables, and actionable insights; all organized in one place.
2. What Problems Does It Solve?
Keeping track of device-level risks without a central tool is frustrating. Data ends up scattered across emails, spreadsheets, and manual notes, making it hard to spot what’s critical or to prove that you’re managing threats properly. The Risk Report tackles this by collecting, displaying, and organizing risk data automatically, so nothing slips through the cracks.
3. How the Risk Report Solves These Problems
The module connects your devices’ real-time risk data to a clear, well-structured dashboard. It shows trends, highlights risks that need your review, offers guidance for what to do next, and keeps a record of every submitted risk. This means you have the facts at your fingertips; no guesswork, no manual data crunching.
4. Risk Report Options – Full Breakdown
Below is how each section works, what you’ll see, and how to use it in practice.
4.1 Dashboard
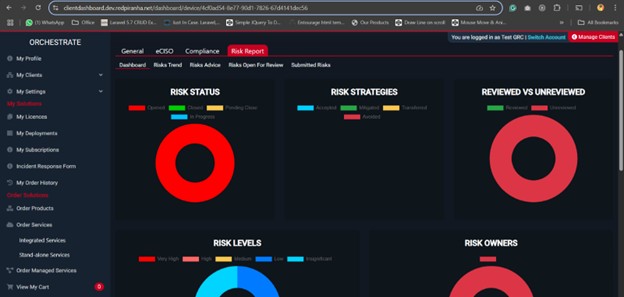
The Dashboard tab is your starting point for a quick, high-level summary. It brings together the key numbers and charts so you can gauge your risk posture in seconds. Use it to answer questions like: How many risks do I have? What’s their severity? Are they being addressed?
What You’ll See
- Risk Status Overview: Counts of risks by status (Opened, Closed, In Progress, Pending Close, etc.)
- Risk Levels: Breakdown by severity (Very High, High, Medium, Low, Insignificant)
- Risk Strategies: How each risk is being handled — Accepted, Mitigated, Transferred, Avoided
- Reviewed vs Unreviewed: Quickly check which risks still need a second look
Visual Elements
- Donut charts to visualize risk categories
- Summary tables for quick scanning
- A monthly overview table to spot trends over time
How to Use It
Start here each time you log in. Read the charts, check for spikes or unusual numbers, and decide if you need to dig deeper into other tabs to investigate.
4.2 Risks Trend
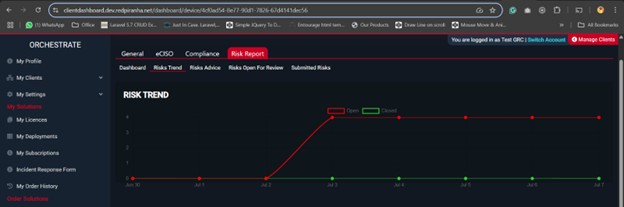
The Risks Trend tab is where you see the bigger picture. Instead of snapshots, this section shows how risks change over months, letting you catch patterns or sudden spikes. It’s ideal for presentations or internal reports to prove that your risk posture is improving (or to justify more resources if it’s not).
What You’ll See
- Line Chart: Plots the number of risks opened and closed each month
- Monthly Overview Table: Detailed counts by month and status
- Export Option: (If available) Download the data to Excel or CSV for deeper analysis
How It Works
- Live data comes in from the backend API
- Charts update dynamically using Chart.js
- The trend table mirrors the chart for precise numbers
Example
| Month | Opened | Closed |
|---|---|---|
| 2025-05 | 3 | 1 |
| 2025-06 | 2 | 2 |
| 2025-07 | 1 | 0 |
How to Use It
Open this tab before meetings or audits. Use the chart to explain progress, spot issues, and back up your plans with real numbers. Export the table if you want to share the raw data.
4.3 Risks Advice
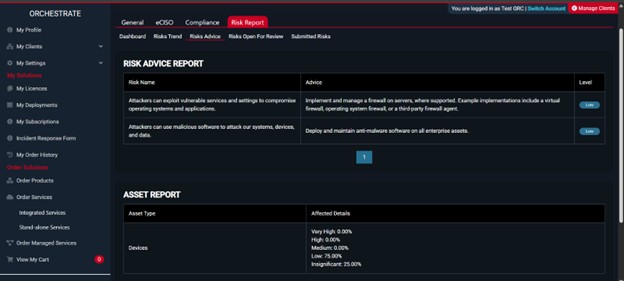
The Risks Advice section takes the guesswork out of risk handling. Instead of leaving you to figure out next steps, it gives you clear recommendations for each risk. This helps teams respond faster and makes sure everyone’s working off the same playbook.
What You’ll See
- Advice Table: Each risk listed with advice or next steps
- Direct Links: If available, click through for detailed remediation guides
- Pagination: Easily navigate large lists of risks and advice
Columns
- Risk Name
- Advice / Recommendation
How to Use It
Regularly check this section and follow the recommendations. Use the links for step-by-step fixes if they’re provided. Mark completed actions in your tracking tool so you’re ready for compliance checks.
4.4 Risks Open for Review
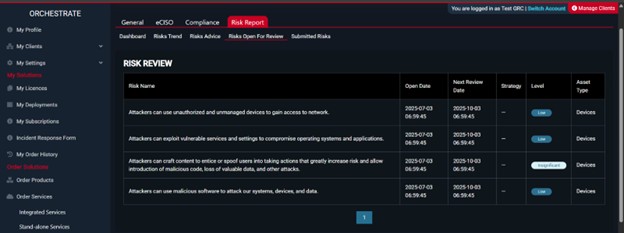
Risks Open for Review is your safety net for accountability. It shows any risks that still need your sign-off or periodic reassessment. Forgetting to review risks can lead to stale data or missed threats — this tab prevents that.
What You’ll See
- Review Table: Risks pending review, with when they were opened and when the next check is due
- Key Details: Strategy used, risk level, and asset type
- Pagination: Handy for long lists
Columns
- Risk Name
- Open Date
- Next Review Date
- Strategy
- Level
- Asset Type
How to Use It
Sort by Next Review Date to see what’s due soon. Block out time to handle reviews so you’re never caught off guard during an audit. Use this to keep your risk posture fresh and trustworthy.
4.5 Submitted Risks
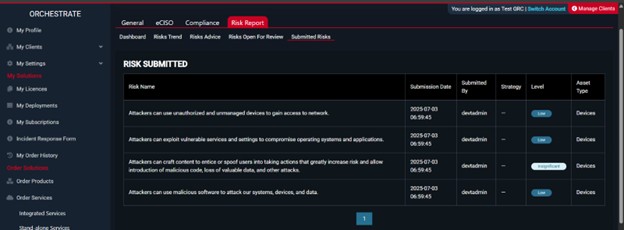
This tab is your record of truth. It shows every risk that’s been formally submitted, who did it, and how it’s being managed. Think of it as your audit trail — evidence that your team is doing its job.
What You’ll See
- Submitted Risks Table: Complete list of submitted risks
- Submission Date: When it was logged
- Submitted By: The user or system that filed the risk
- Strategy & Level: How it’s being handled and its severity
- Asset Type: The affected device or asset
- Pagination: For large data sets
Columns
- Risk Name
- Submission Date
- Submitted By
- Strategy
- Level
- Asset Type
How to Use It
Check this regularly to ensure submissions are accurate and up to date. Use it for reporting to leadership or compliance bodies. If something looks off, trace it back to the submitter for correction.
5. How Data Flows: Sources & Integration
The Risk Report module connects directly to your Orchestrate backend via API. Each time you open a tab, fresh data is fetched using unique device IDs and secure tokens. This keeps your reports current without manual data pulls.
6. User Interface & Navigation Tips
The Risk Report is simple to navigate once you know how it’s laid out. Each section has tabs at the top — click them to switch instantly. Use the charts for a quick overview and the tables for detailed insights. When loading, you’ll see a spinner — don’t panic, it’s just fetching fresh data.
Visual Tips
- Charts: Donut charts for risk status, line charts for trends.
- Tables: Paginated so you can handle hundreds of risks easily.
- Colors: High risks show red, low risks are blue, and insignificant ones are faded — easy to spot.
Tip
Keep your cursor near filters and pagination controls so you can flip through data fast.
This makes day-to-day tracking smooth and efficient, even with large deployments.
This guide covers what the Risk Report does, how it works, and exactly how to use it day to day. When used right, it’s your go-to tool for real-time risk tracking, reporting, and compliance.